Part 2: Edit the Collector configuration to filter and send logs to Splunk Cloud Platform 🔗
In the previous part of this tutorial, you installed the Splunk Distribution of OpenTelemetry Collector in your local Kubernetes cluster. See Tutorial: Configure the Splunk Distribution of OpenTelemetry Collector on Kubernetes for an overview of the tutorial.
You can now edit the default configuration to modify or extend the capabilities of the Collector, for example by adding different components or by editing existing settings.
In the following steps, you’ll edit the configuration of the Collector using YAML files and Helm. At the end of this part of the tutorial, you’ll be able to complete the following tasks:
Activate logs collection using the Filelog receiver and the OpenTelemetry protocol (OTLP).
Filter logs using the filter processor.
Export the filtered logs to Splunk Cloud Platform.
Download and examine the default values.yaml file 🔗
By default, the Helm chart for the Splunk Distribution of OpenTelemetry Collector deploys the Collector with predefined settings. All possible settings are documented in the values.yaml file. To modify the configuration, you either override existing settings or add new settings using YAML files or command-line arguments.
Download the default values.yaml file from GitHub and save it in a directory you can refer to later on. Open the file using your favorite code or text editor.
Take a moment to read through the values.yaml file and examine its structure. Notice how each section configures the Collector for different targets, such as Splunk Observability Cloud and Splunk Cloud Platform. The comments in the file contain useful indications as to which values you can use and what’s their effect.
Configure the Splunk HEC endpoint and token 🔗
The Splunk OpenTelemetry Collector for Kubernetes collects logs by default. To send the logs to Splunk Cloud Platform, you need to add the Splunk HTTP Event Collector (HEC) endpoint and token to the configuration. See Splunk HEC token and endpoint.
Create a new YAML file. For example, hec.yaml.
Open the hec.yaml file in a code or text editor.
Paste the following snippet into the file:
splunkPlatform:
  endpoint: "<your_hec_endpoint>"
  token: "<your_hec_token>"
For logs, the
mainindex is the default. If you’re using a different index for this tutorial, set an index to match the index you’re using:splunkPlatform: endpoint: "<your_hec_endpoint>" token: "<your_hec_token>" index: "<your_index>"
Save the file.
With this configuration file, you can deploy a functional Collector that sends logs to Splunk Cloud Platform.
Create a filter processor configuration file 🔗
Create a new file called filter.yaml in the same directory as the hec.yaml file you created in the previous step.
Open the file in your code or text editor and add the following snippet:
agent:
  config:
    processors:
      filter/exclude_logs_from_pod:
        logs:
          exclude:
            match_type: regexp
            resource_attributes:
              - key: k8s.pod.name
                value: '^(podNameX)$'
      filter/exclude_logs_from_node:
        logs:
          exclude:
            match_type: regexp
            resource_attributes:
              - key: k8s.node.name
                value: '^(nodeNameX)$'
    service:
      pipelines:
        logs:
          processors:
            - memory_limiter
            - k8sattributes
            - filter/logs
            - batch
            - resourcedetection
            - resource
            - resource/logs
            - filter/exclude_logs_from_pod
            - filter/exclude_logs_from_node
The previous snippet instructs Helm to add filter processor settings to the agent configuration and add them to the logs pipeline together with the default processors. The filters exclude logs from pods and nodes that match the specified regular expressions.
Save the filter.yaml configuration file and continue to the next step.
Apply the new configuration 🔗
To apply the configuration to the Collector running on your Kubernetes cluster, run the following command from the directory that contains the YAML files:
helm upgrade --reuse-values -f ./filter.yaml -f ./values.yaml splunk-otel-collector-1709226095 splunk-otel-collector-chart/splunk-otel-collector --set="splunkPlatform.insecureSkipVerify=true"
Use the Tab key to autocomplete the file names, the release, and the chart you installed in part 1 of this tutorial.
Notice the following parts of the command:
--reuse-valuesensures that the Collector updates only the settings you provide.--setdefines settings through the command line. You can use this method as an alternative to passing YAML files.splunkPlatform.insecureSkipVerify=trueturns off SSL, since Splunk Cloud Platform free trials don’t support it.
Caution
Don’t set insecureSkipVerify to true in production environments, since it might compromise the security of your data. In this tutorial, you need to turn off SSL because trial versions of Splunk Cloud Platform don’t support it.
After upgrading the configuration, Helm shows messages similar to the following example:
Release "splunk-otel-collector-1709226095" has been upgraded. Happy Helming!
NAME: splunk-otel-collector-1709226095
LAST DEPLOYED: Thu Mar  7 19:23:30 2024
NAMESPACE: default
STATUS: deployed
NOTES:
Splunk OpenTelemetry Collector is installed and configured to send data to Splunk Platform endpoint "https://<your-splunk-cloud-trial-stack>.splunkcloud.com:8088/services/collector".

Splunk OpenTelemetry Collector is installed and configured to send data to Splunk Observability realm us0.
Check that logs are received by Splunk Cloud Platform 🔗
Log in to Splunk Cloud Platform and go to the Search & Reporting app.
In the search bar, enter index=”<your_index>” to see the logs coming from your local Kubernetes cluster:
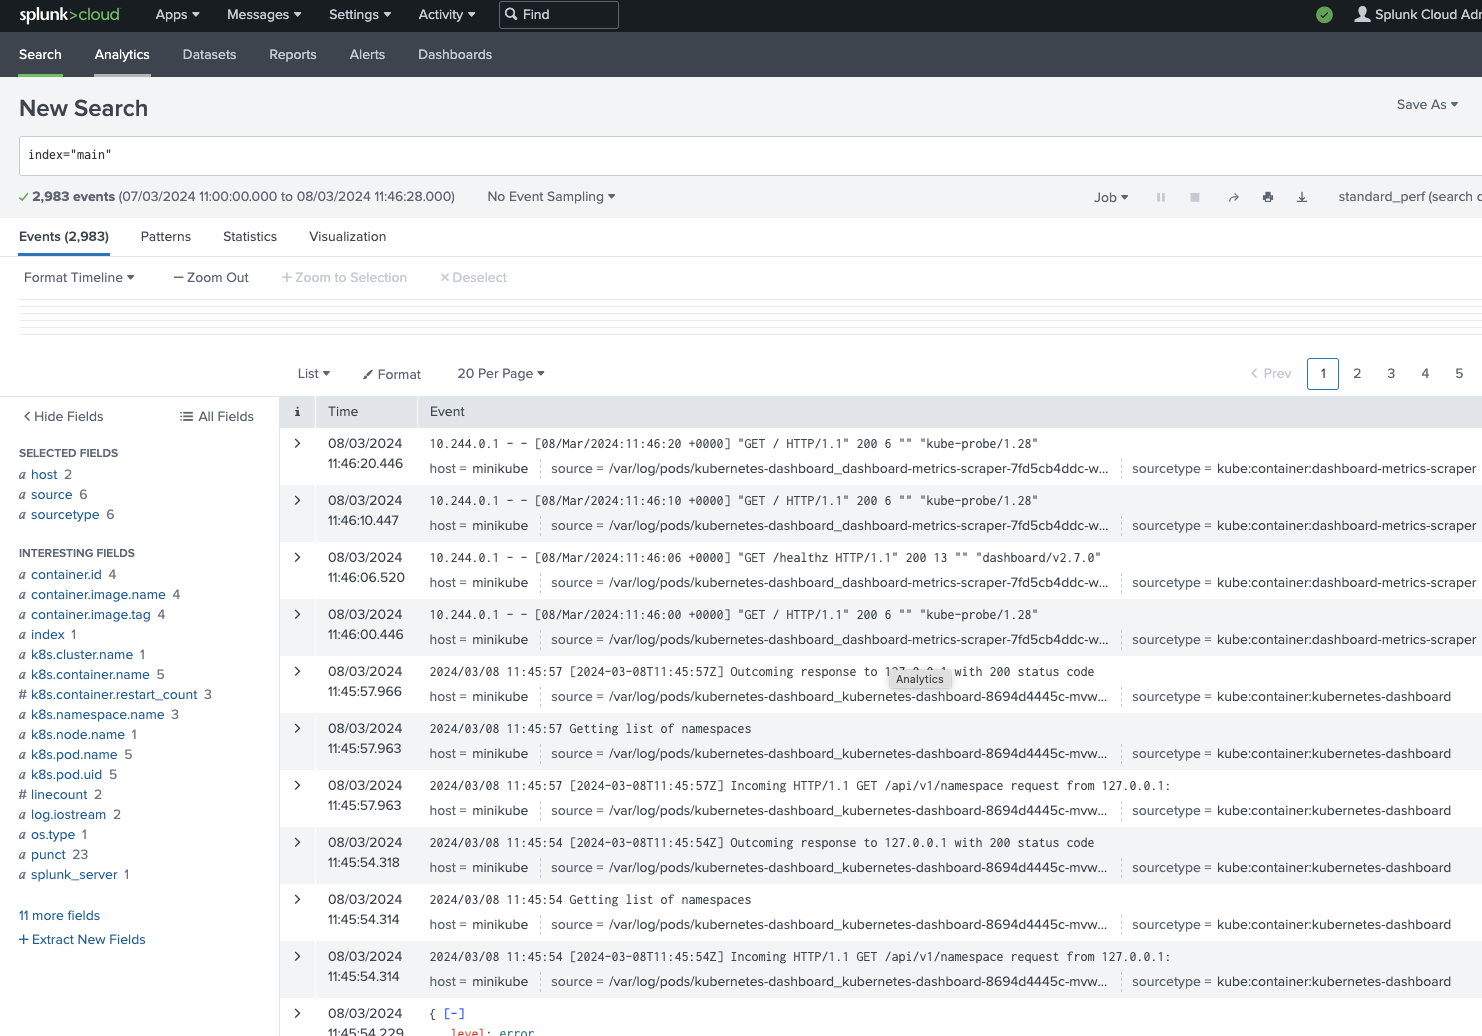
If events appear in the search results, the logs from your Kubernetes cluster are getting to Splunk Cloud Platform.
Learn more 🔗
This completes the tutorial. You created a local Kubernetes cluster, configured it, and sent the logs to Splunk Cloud Platform. Well done! Now you can continue exploring the different settings of the Helm chart.
To learn more about the Collector installation and components, see the following resources: