Part 1: Set up and monitor a Kubernetes cluster on your machine 🔗
To follow the tutorial, you need a Kubernetes environment on your machine. See Tutorial: Configure the Splunk Distribution of OpenTelemetry Collector on Kubernetes for an overview of the tutorial.
A convenient way of setting up a demo Kubernetes environment is through Minikube, Podman, and Helm. Each tool has a specific purpose:
Minikube creates a local Kubernetes cluster.
Podman runs containers in Kubernetes.
Helm helps configure Kubernetes.
Note
You don’t need Podman if you already have a container runtime installed, such as Docker.
The following steps assume that you’re using macOS as the host operating system. You also need the Homebrew package manager. If you don’t have Homebrew installed, run the following command first in your terminal:
/bin/bash -c "$(curl -fsSL https://raw.githubusercontent.com/Homebrew/install/HEAD/install.sh)"
Install the requirements 🔗
Open a terminal session and install Minikube, Helm, and Podman using Homebrew:
brew install minikube helm podman
Check that you installed all the requirements by running the following commands:
minikube version
# minikube version: v1.32.0
podman -v
# podman version 4.9.3
helm version
# version.BuildInfo{Version:"v3.14.2", ...}
Create a local Kubernetes cluster 🔗
To start the local Kubernetes cluster to use in this tutorial, run the following command:
minikube start
After 5 minutes, the following message appears to communicate that Minikube successfully created the cluster:
Done! kubectl is now configured to use "minikube" cluster and "default" namespace by default
To test your newly created cluster, run the following command:
minikube dashboard
The Kubernetes dashboard appears empty in your browser, meaning that you still haven’t deployed a containerized app. Your next step installs the first containerized app, the Collector, in your cluster.
Install the Splunk Distribution of OpenTelemetry Collector 🔗
To complete this part of the tutorial, the last step consists in installing the Splunk Distribution of OpenTelemetry Collector using the Helm chart.
Run the following commands to install the Helm chart for the Collector:
helm repo add splunk-otel-collector-chart https://signalfx.github.io/splunk-otel-collector-chart
helm repo update
helm install --set="splunkObservability.accessToken=<access_token>,clusterName=splunkTutorial,splunkObservability.realm=<realm>,gateway.enabled=false,splunkObservability.profilingEnabled=true,environment=splunkTutorialEnv" --generate-name splunk-otel-collector-chart/splunk-otel-collector
Replace <realm> and <access_token> in the installation command with your realm and access token.
To obtain an access token, see Retrieve and manage user API access tokens using Splunk Observability Cloud.
To find your Splunk Observability Cloud realm, see Note about realms.
Note
You can also generate a prefilled Helm command using the Collector guided setup in Splunk Observability Cloud.
After successfully installing the Helm chart, messages similar to the following appear:
NAME: splunk-otel-collector-1709226095
LAST DEPLOYED: Thu Feb 29 18:01:36 2024
NAMESPACE: default
STATUS: deployed
NOTES:
Splunk OpenTelemetry Collector is installed and configured to send data to Splunk Observability realm <realm>.
Check that data is coming into Splunk Observability Cloud 🔗
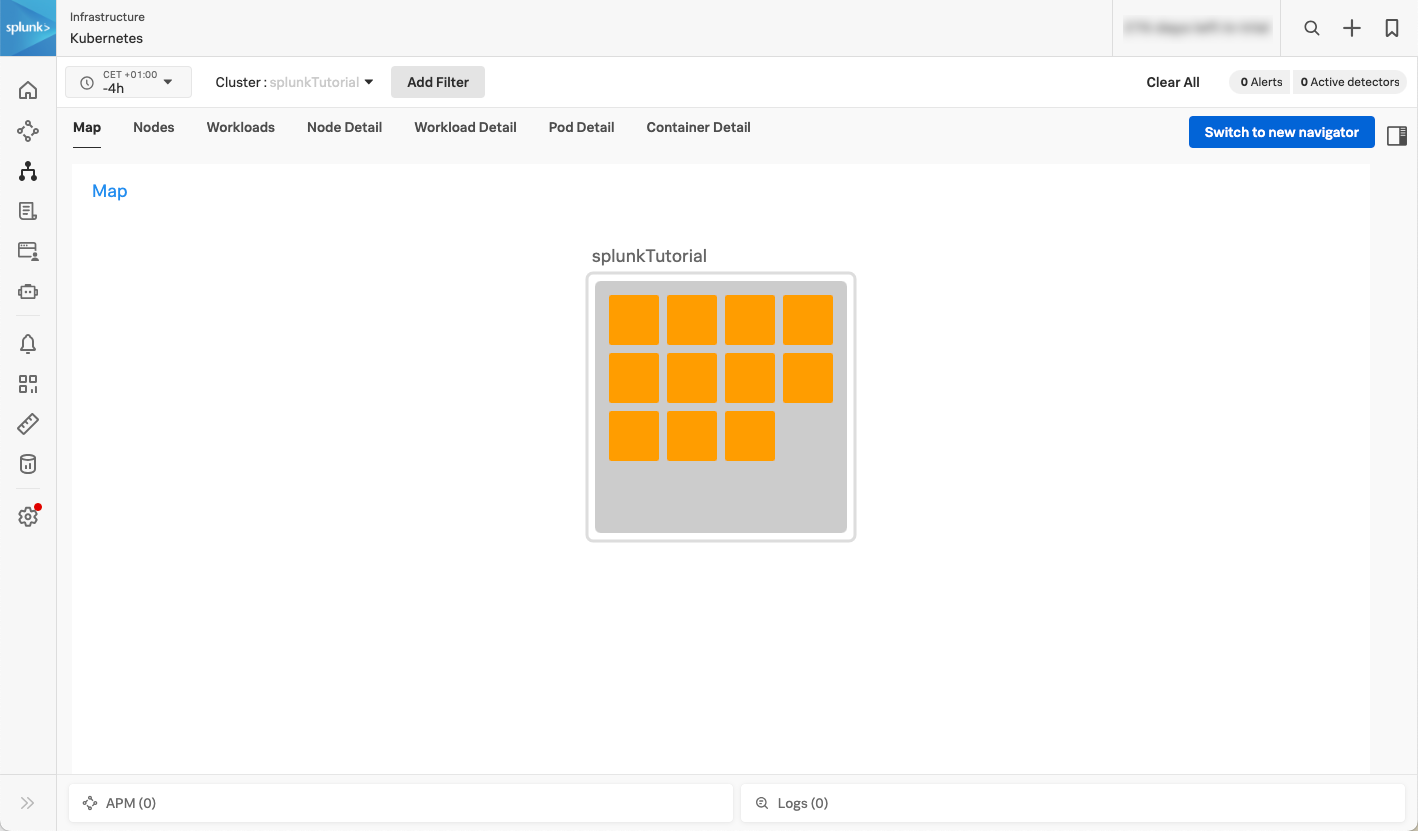
Open Splunk Observability Cloud and go to Infrastructure, Kubernetes, K8s nodes to see the data coming from your local Kubernetes clusters. Filter to only show the splunkTutorial cluster.
The following image shows data coming from the demo splunkTutorial cluster:
Next step 🔗
This completes the first part of the tutorial. You’ve created a local Kubernetes cluster and deployed the Collector as a containerized app.
Next, you’ll edit the configuration to send logs to Splunk Cloud Platform. Continue to Part 2: Edit the Collector configuration to filter and send logs to Splunk Cloud Platform.
Learn more 🔗
To learn more about the Collector configuration format and structure, see the following resources: