Open logs in Splunk platform 🔗
You can search Splunk Observability Cloud logs if your Splunk Observability Cloud instance ingests logs. If your organization has integrated its Splunk platform (Splunk Cloud Platform or Splunk Enterprise) instance with its Splunk Observability Cloud instance, you can search Splunk platform logs that your Splunk platform role has permissions to see in Splunk platform. You can also open the logs in Splunk platform for additional SPL querying.
To open your logs in Splunk platform, follow these steps:
Navigate to Log Observer. Upon opening, Log Observer runs an initial search of all indexes you have access to and returns the most recent 150,000 logs. The search then defaults to Pause in order to save Splunk Virtual Compute (SVC) resources. Control your SVC resources, which impact performance and cost, by leaving your search on Pause when you are not monitoring incoming logs, and select Play when you want to see more incoming logs.

Note
To increase performance and help control cost, search jobs originating from Related Content stop running after 2 minutes of inactivity. All other search jobs stop running after fifteen minutes.
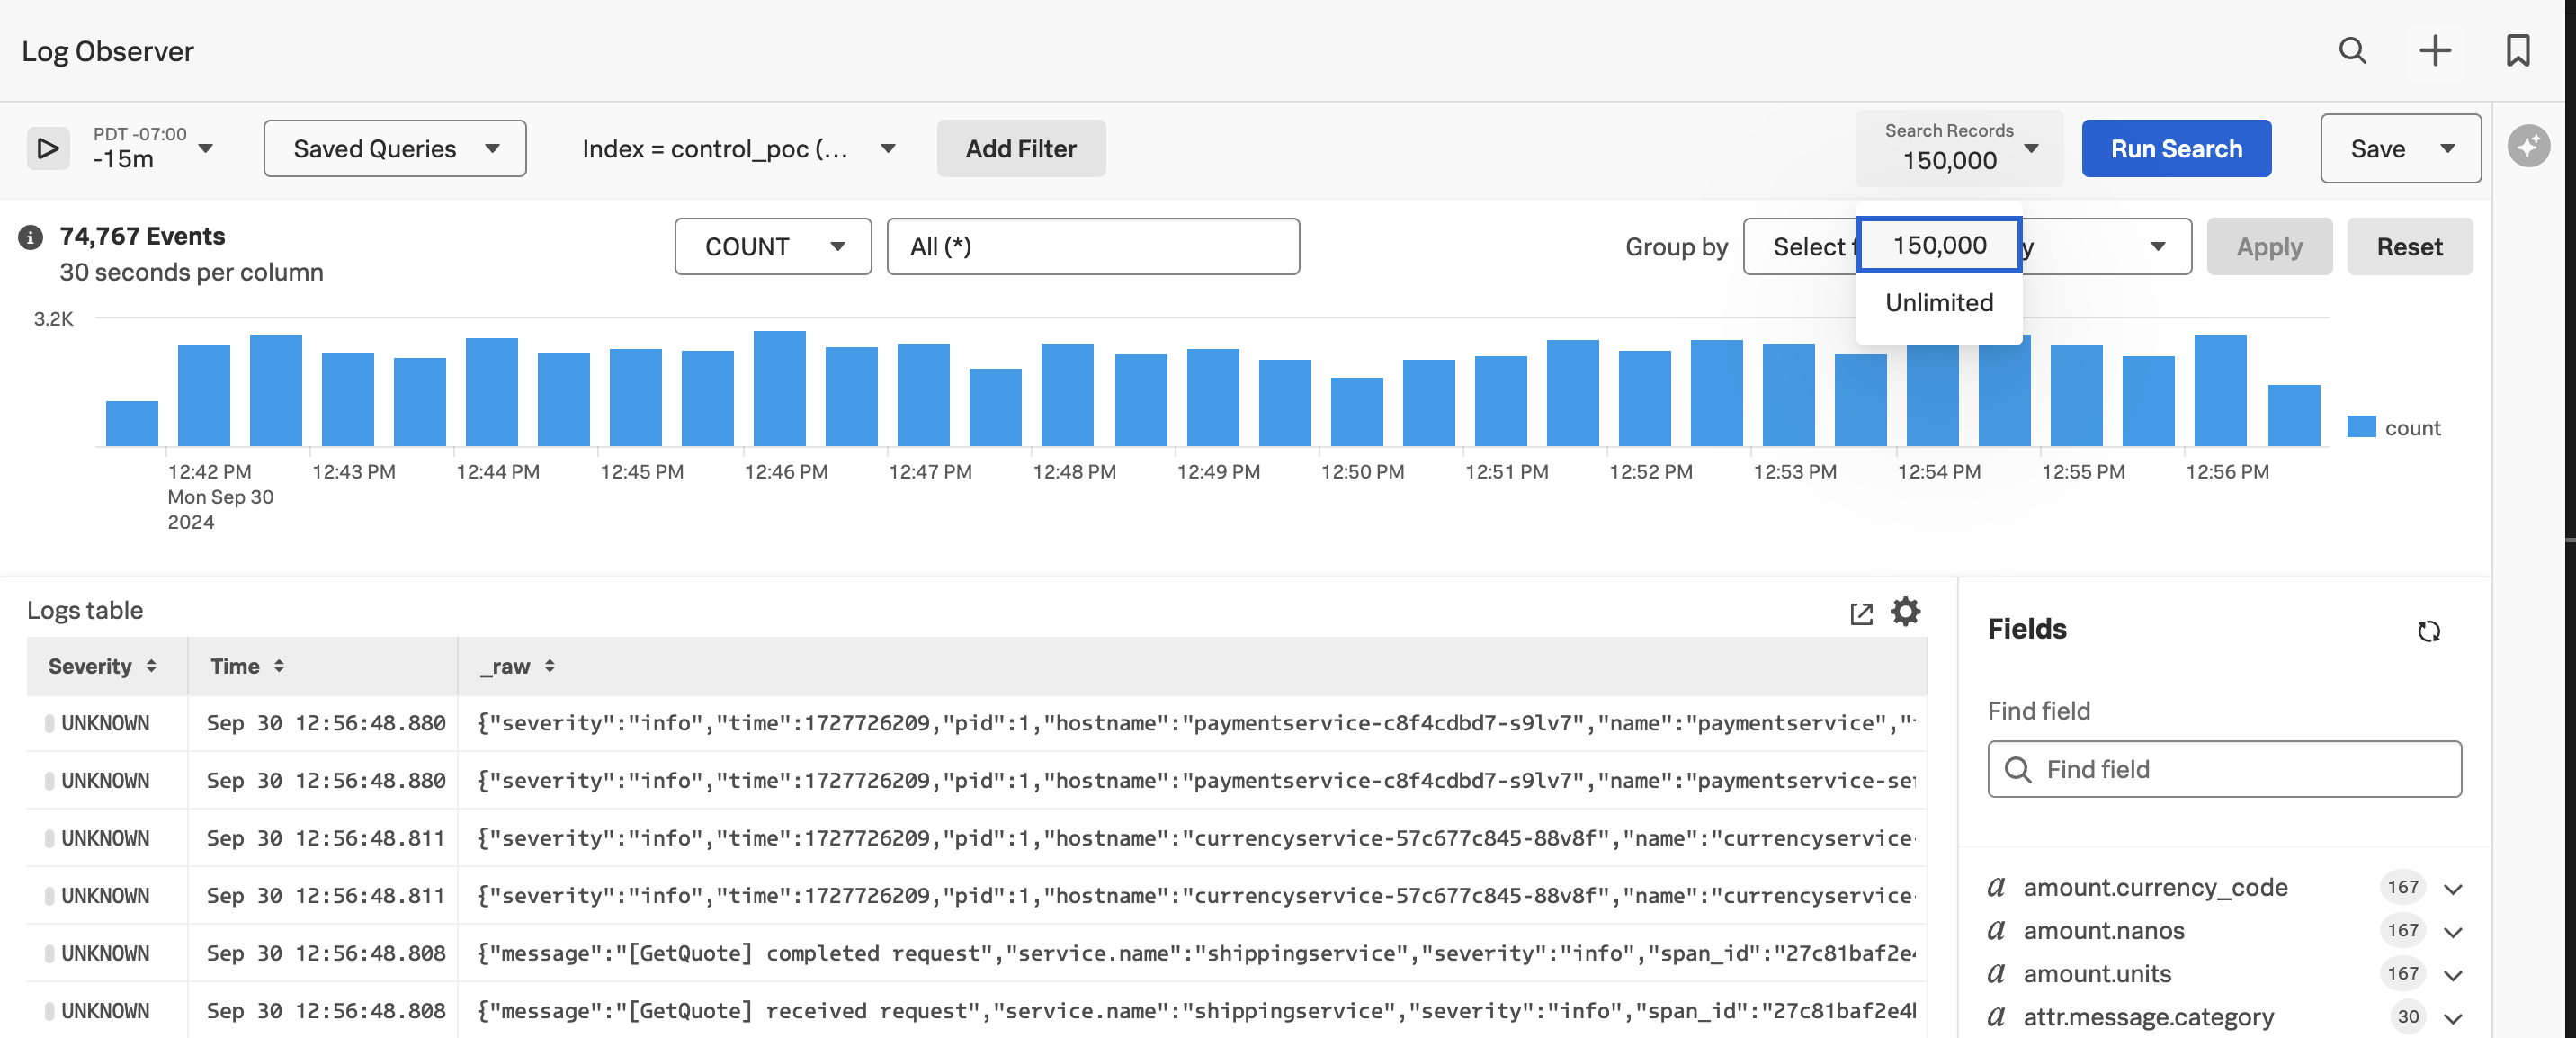
In the content control bar, enter a time range in the time picker if you want to see logs from a specific historical period. To select a time range, you must select Unlimited from the Search Records field in step 5 below. When you select 150,000, Log Observer returns only the most recent 150,000 logs regardless of the time range you select.
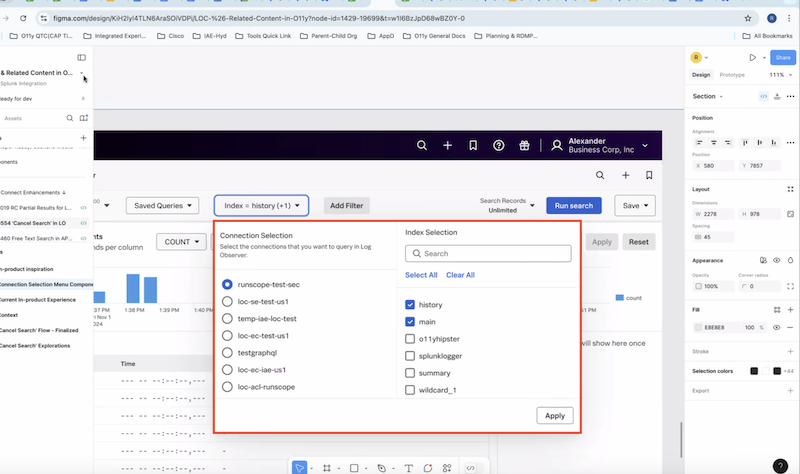
Select Index next to Saved Queries. In the pop-up window, first select a Splunk platform (Splunk Cloud Platform or Splunk Enterprise) connection in the Connection selection section. Then, in the Index selection section, select which index you want to query in Log Observer Connect.

Note
You can query indexes from only one Splunk platform instance at a time. You can query Splunk platform indexes only if you have the appropriate role and permissions in Splunk platform.
In the content control bar next to the index picker, select Add Filter. Select the Keyword tab to search on a keyword or phrase. Select the Fields tab to search on a field. Then press Enter. To continue adding keywords or fields to the search, select Add Filter again.
Next, select Unlimited or 150,000 from the Search Records field to determine the number of logs you want to return on a single search. Select 150,000 to optimize your Splunk Virtual Compute (SVC) resources and control performance and cost. However, only the most recent 150,000 logs display. To see a specific time range, you must select Infinite.
To narrow your search, use the Group by drop-down list to select the field or fields by which you want to group your results, then select Apply. To learn more about aggregations, see Group logs by fields using log aggregation.
Select Run search.
[Optional] If you want to stop the current search, select Cancel search. Partial results do not display. To continue your search, select Run search again.
Review the top values for your query on the the Fields panel on right. This list includes the count of each value in the log records. To include log records with a particular value, select the field name, then select
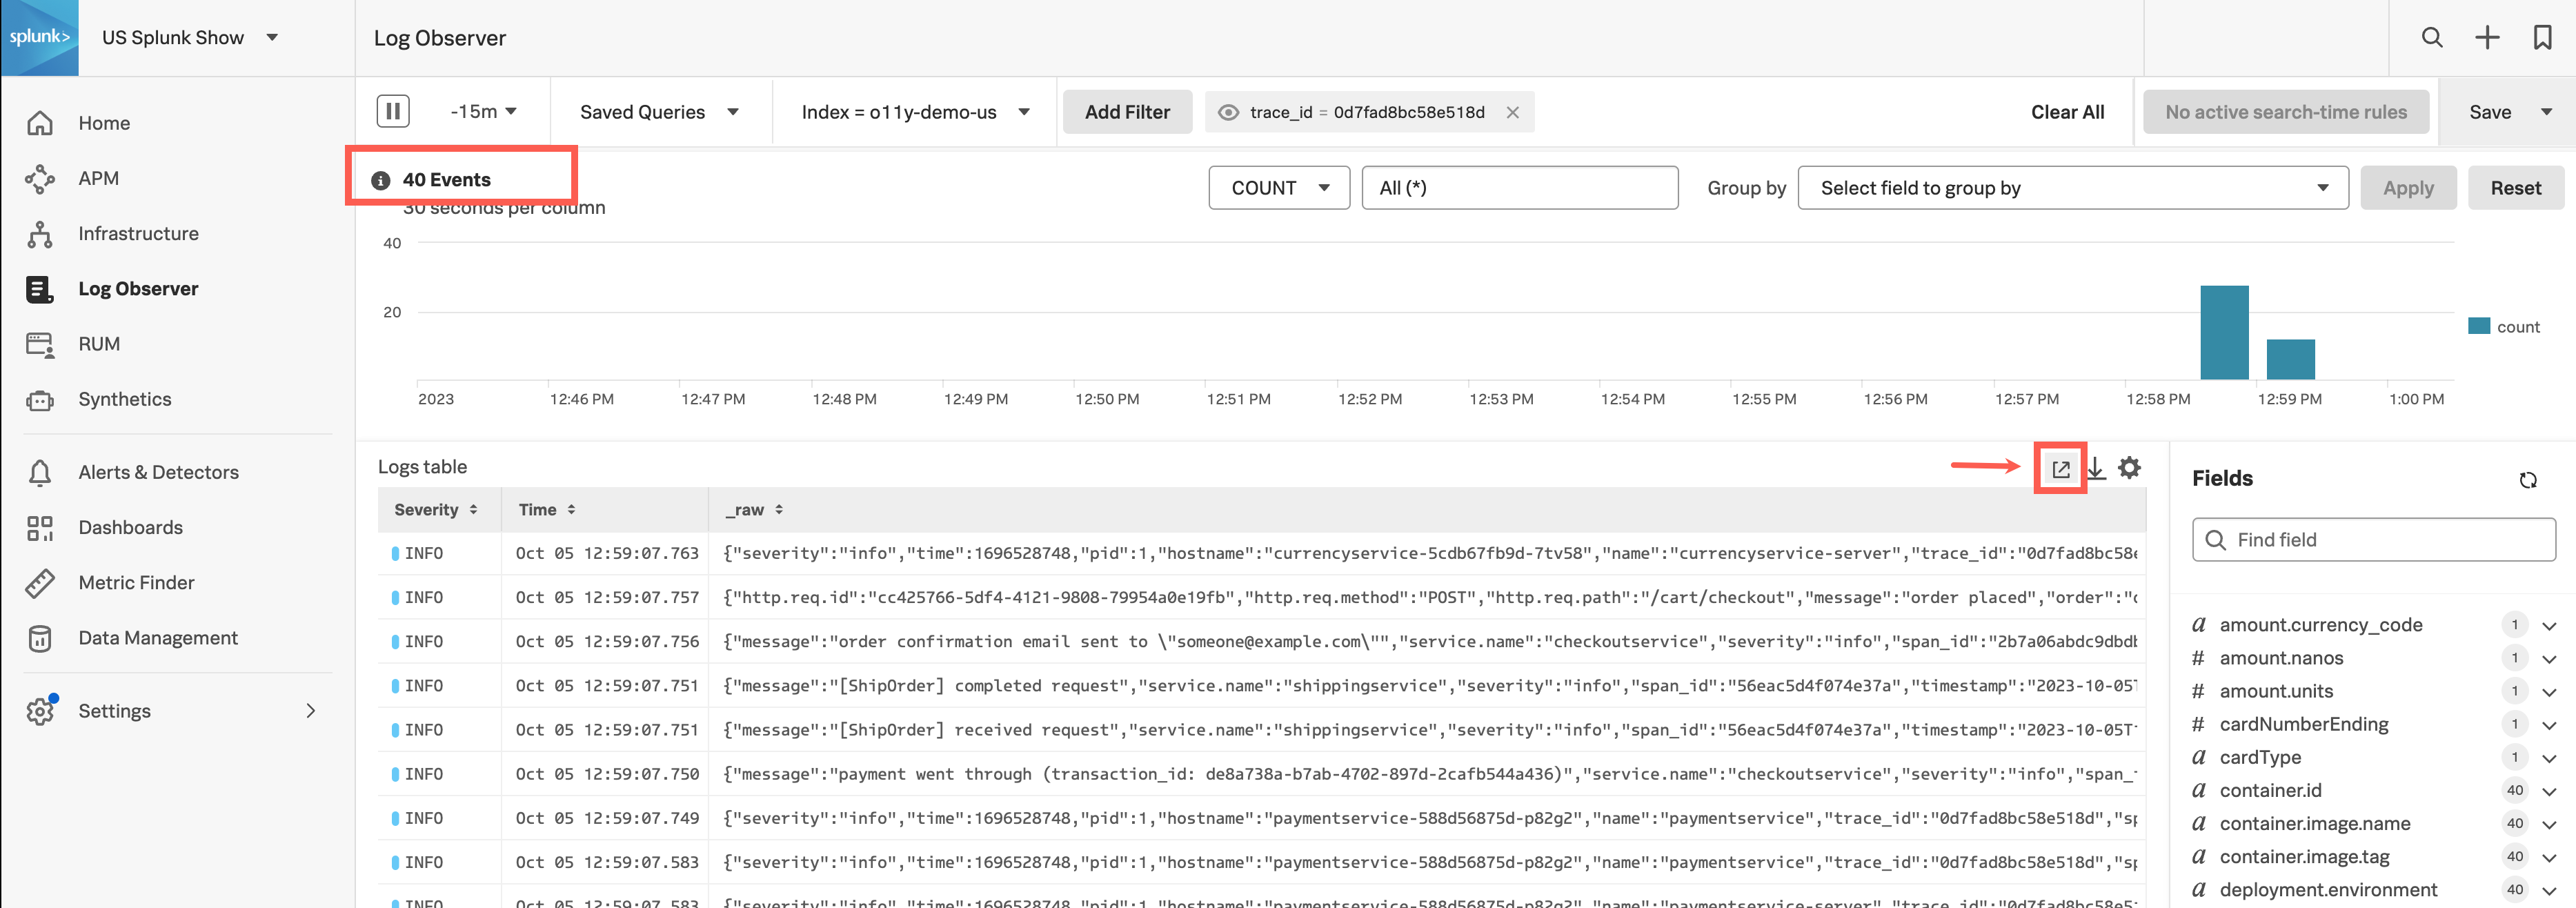
=. To exclude log records with a particular value from your results, select the field name, then select!=. To see the full list of values and distribution for this field, select Explore all values.[Optional] If you are viewing Splunk platform data, you can open your query results in the Splunk platform and use SPL to further query the resulting logs. You must have an account in Splunk platform. To open the log results in the Splunk platform, select the Open in Splunk platform icon at the top of the Logs table.
When you add keywords, field names, or field values to the filters, Log Observer narrows the results in the Timeline and the Logs table so that only records containing the selected fields and values appear. To learn how you can use a productive search in the future, see Save and share Log Observer Connect queries.
