Scenario: Kai monitors detector service latency for a group of customers 🔗
Kai, a site reliability engineer at the fictitious Buttercup Games, wants to monitor a latency issue affecting a critical checkout workflow for the cart service and /getcart endpoint for a specific set of customers who most frequently have problems with the service.
Kai takes the following steps to monitor latency in the cart service:
Kai generates a Monitoring MetricSet (MMS) and filters by span tag
Kai sets up charts, dashboards, and alerts for custom dimensions
Kai generates a Monitoring MetricSet (MMS) and filters by span tag 🔗
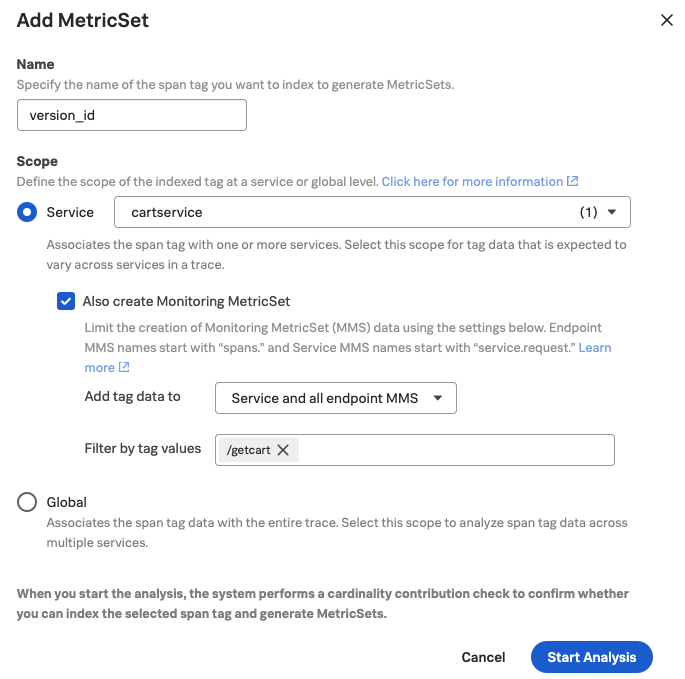
To generate Monitoring MetricSets (MMS) by customer, Kai indexes a span tag to identify each customer: version_id. Kai then generates an MMS using version_id as a dimension. Kai sets the scope of the MMS to the cartservice, and filters on the tag values for version_id that represent the specific list of customers Kai wants to investigate.
This image shows an example MMS configuration for the cartservice endpoint /getcart and a filter by tag values for version_id:
Kai creates service latency detectors to track metrics 🔗
Kai uses the custom dimensionalized MMS they created to monitor the performance of this critical checkout workflow in the cart service. To do this, Kai creates a detector using the same custom indexed tag, version_id, to track error rates associated with the checkout workflow.
Kai follows the guided setup detector creation to create their detector based on the error rate in the service cartservice:GetCart, filtered to the custom dimension of version_id.
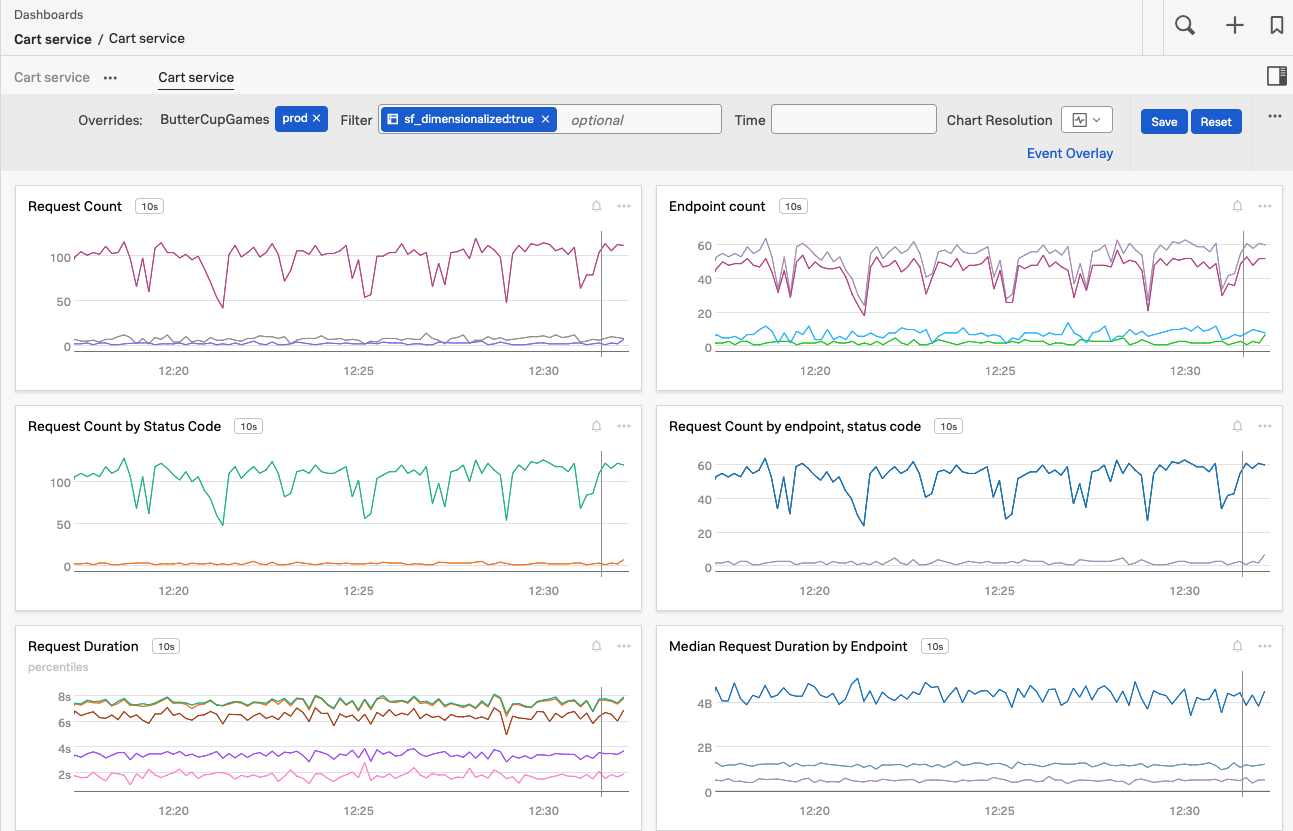
Kai uses the metric finder to find additional information on the metrics and metadata for their system. Kai applies sf_dimensionalized:true as a filter to see related metrics as shown in the following image.

Kai sets up charts, dashboards, and alerts for custom dimensions 🔗
Kai also creates charts and dashboards that use the custom dimensions they created.
Summary 🔗
By generating an MMS with version_id as a custom dimension and filtering it to the customers affected by the issue, Kai set up a detector to monitor service and endpoint latency by customer. Kai also created charts and dashboards that show service and endpoint latency for specific customers over time.
Learn more 🔗
See Index span tags to create Troubleshooting MetricSets for more information about indexing span tags.
See Create a Monitoring MetricSet with a custom dimension for more information about generating a custom MMS.
See Search the Metric Finder and Metadata Catalog for more information about additional metrics and metadata.
See Configure detectors and alerts in Splunk APM for more information on configuring detectors and alerts for APM.
See Track service performance using dashboards in Splunk APM for more information about monitoring services in APM dashboards.
See Create charts in Splunk Observability Cloud for more information about creating charts.
See Create and customize dashboards for more information about creating dashboards.