Scenario: Skyler analyzes historical data to optimize system performance using the built-in dashboard 🔗
Skyler, a performance engineer at Buttercup Games, wants to understand and analyze the end-to-end performance of microservices to optimize the system.
These are the steps Skyler takes to analyze microservice performance:
Skyler opens the service-level dashboard 🔗
Skyler opens the service-level Splunk APM services dashboard under Dashboards > Built-in Dashboard Groups in Splunk Observability Cloud:
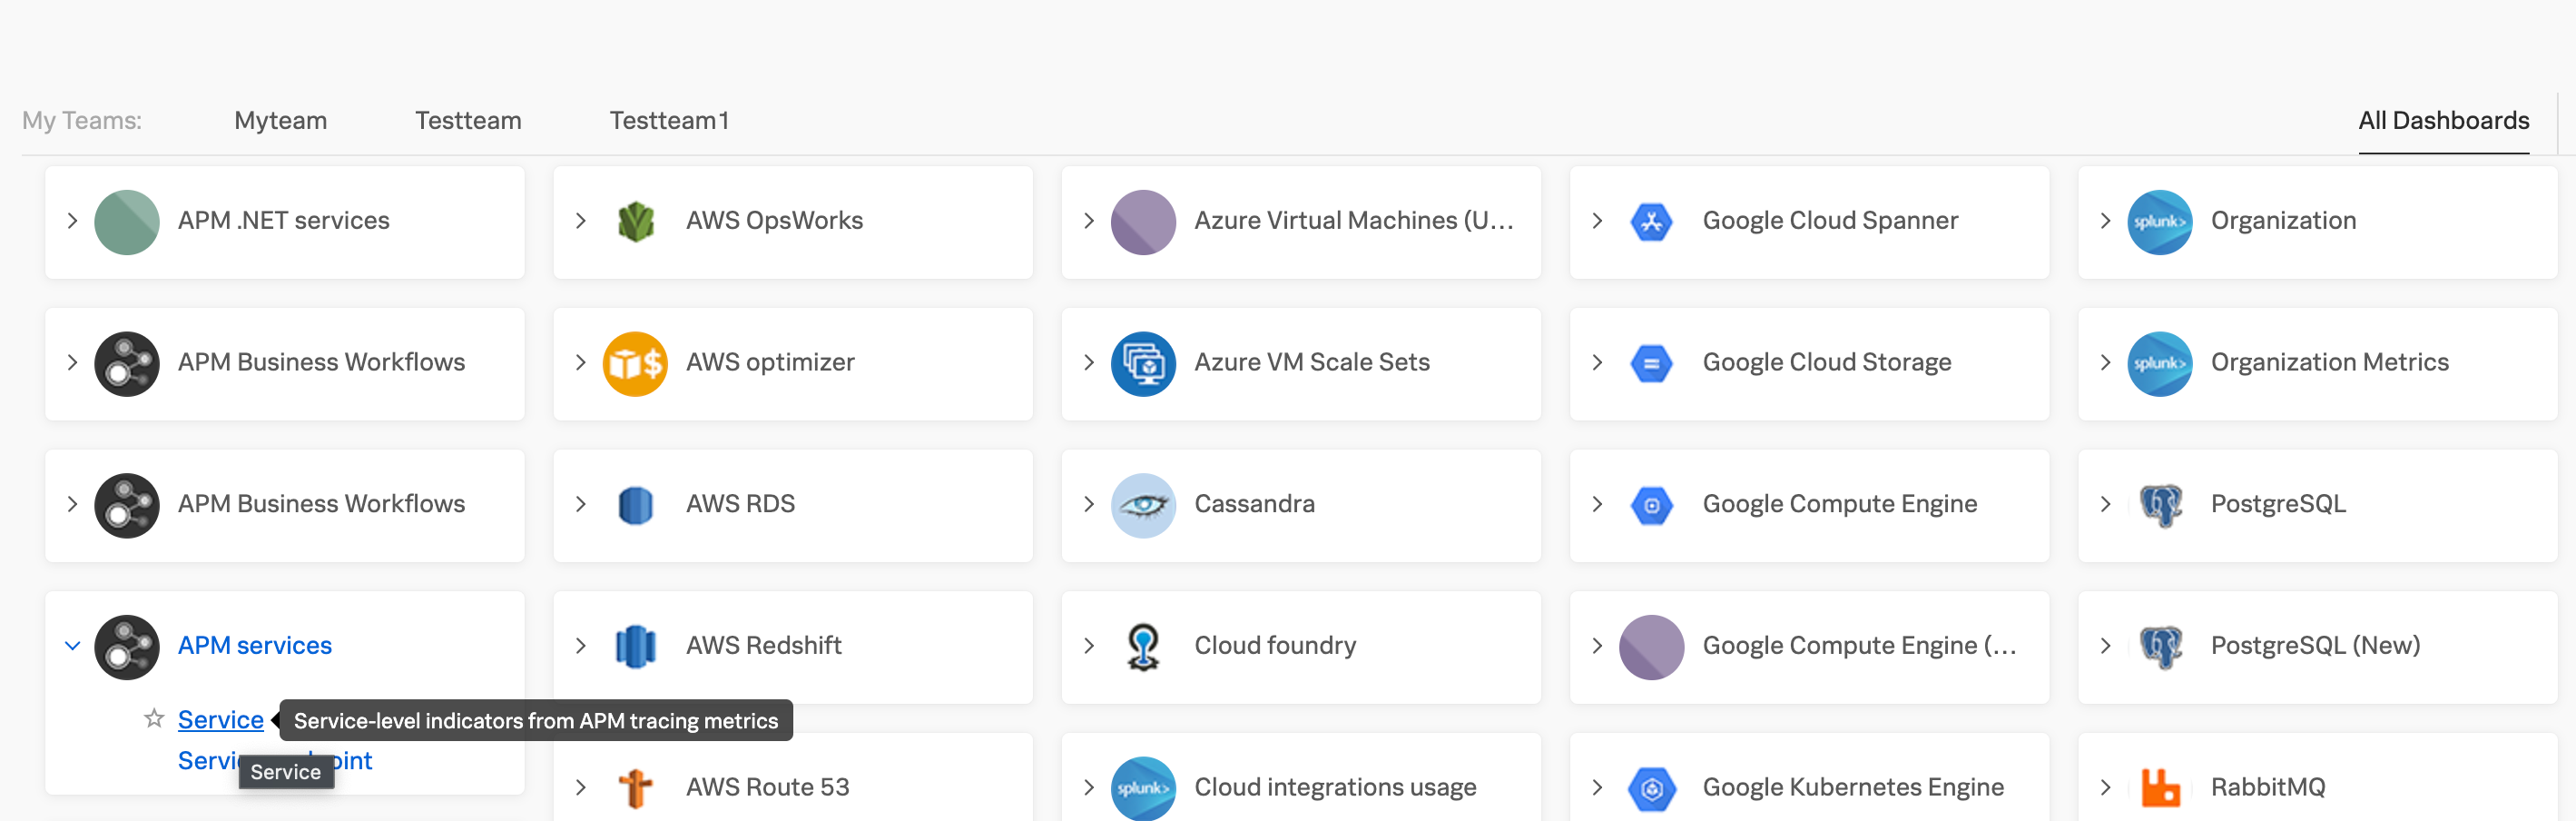
Skyler selects the checkout service to view long-term latency 🔗
Skyler selects the checkoutservice because the service triggered the APM detector for atypical latency multiple times during the past 6 months. Skyler sets the dashboard time range to the past 6 months to analyze its long-term latency distribution.
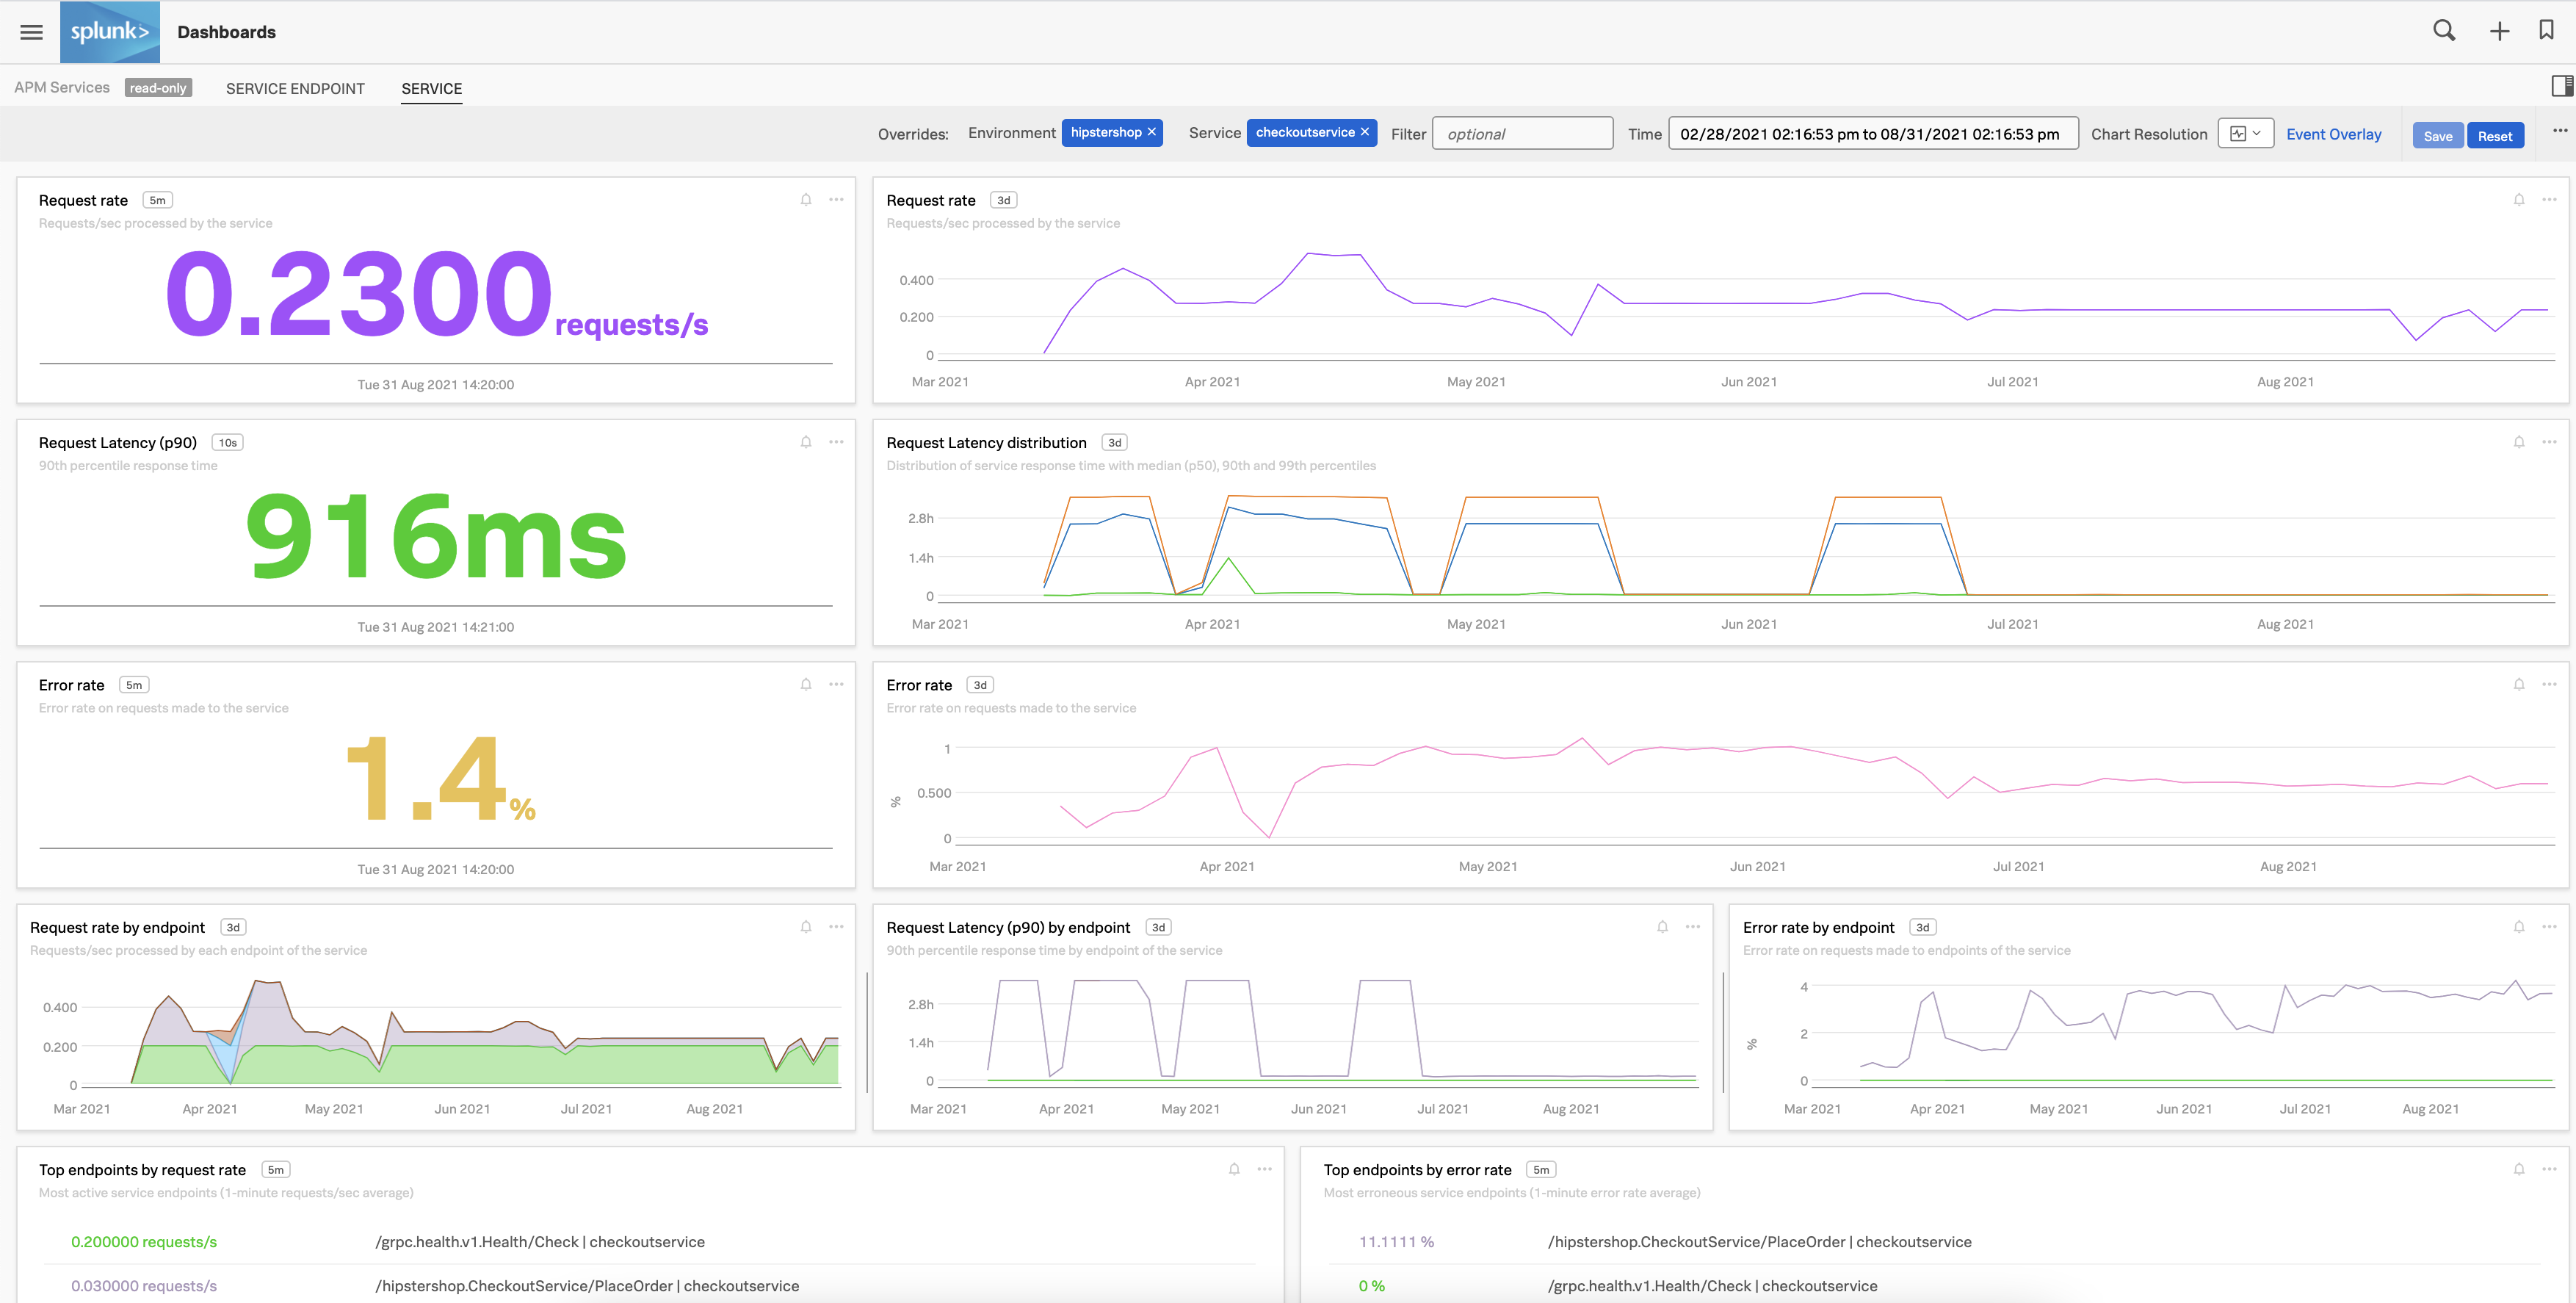
Summary 🔗
Using the latency chart in the built-in APM service dashboard, Skyler determines that high latency in the checkout service corresponds to days during which Buttercup Games was having special sales or deploying major code changes to the system. Skyler identifies increased traffic due to special sales and code releases as possible causes of the high latency and uses this information to improve system performance.
Learn more 🔗
See Track service performance using dashboards in Splunk APM for more information on built-in APM dashboards.