Create and customize dashboards 🔗
You can quickly visualize the metrics you monitor using Splunk Observability Cloud dashboards. This topic explains how to create and customize these dashboards, as well as how to customize mirrored dashboards. If you are unfamiliar with dashboards or need a refresher, see Dashboard and dashboard group types in Splunk Observability Cloud.
Create a dashboard 🔗
Using Splunk Infrastructure Monitoring, you can quickly add simple charts to a new dashboard and share a copy of that dashboard with others.
Note
If you see Dashboard (unsaved), you have already added charts to a new dashboard and haven’t saved the dashboard yet. Select this option to open the unsaved dashboard. You can only have one unsaved dashboard at a time.
If you see Dashboard with <n> copied charts, you have copied some charts from one or more dashboards and haven’t yet added any charts to a new (unsaved) dashboard. Clicking this option creates a dashboard and pastes the copied charts into it.
In the Chart Builder, when saving a new chart or using Save as to save a copy of an existing chart, you can create a dashboard on which to place the chart.
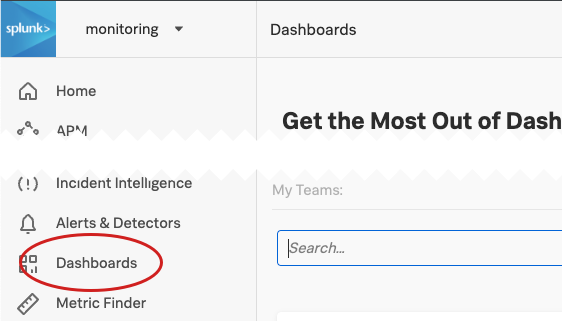
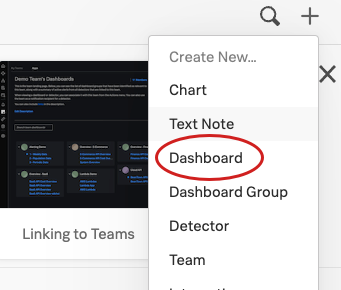
To create a dashboard, follow these steps:
Change a dashboard’s name or description 🔗
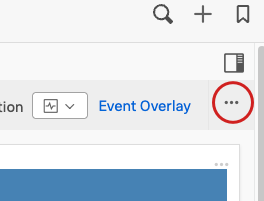
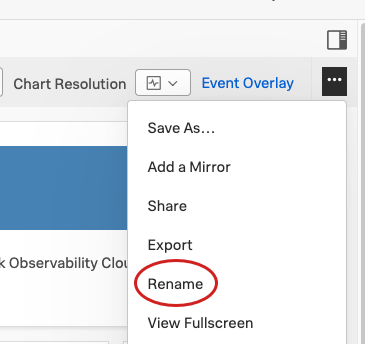
To rename a dashboard or change the dashboard’s description, follow these steps:
Customize dashboard filters 🔗
After you create the dashboard, you can customize the dashboard filters from the Overrides bar or the Dashboard Info tab. As with any dashboard, changes you make to filters on the Overrides bar take effect immediately, which lets you modify your view and explore your data in real time.
Customizing mirrored dashboard filters 🔗
Define any filters you want applied to the dashboard. By default, the dashboard has the same filters as the dashboard you are mirroring. Setting filters here means the target mirror has different default filters applied. Any user with write permission for the dashboard group can also set filters.
If you apply filters and want them displayed on the mirror by default, select Save to save the mirror with the filters applied. After you save the mirror, the new filters appear in the customization section in the dashboard info tab.
On the Dashboard Info tab, anyone with dashboard write permissions can apply filters to the dashboard (in the top portion of the tab). These filters affect all mirrors that don’t have filter customizations applied.
If you want to apply a filter override, you can either add a filter to use in place of the dashboard default filter, or you can leave the filter value blank. Leaving the filter value blank means the mirror doesn’t have any filters applied by default.
Customize dashboard variables 🔗
You can define various dashboard variable settings that take effect for any chart in this dashboard. Select Dashboard variables from the dashboard actions menu.
When you save these settings, the dashboard variable and the suggested values now reflect the customizations you specified.
Customizing mirrored dashboard variables 🔗
You can make changes directly on the Overrides bar; if you save the mirror, these settings become default values in the Variable details section of the Dashboard variables tab.
When you save customization options that you set in the Dashboard variables tab, these changes are automatically saved as default settings for this mirror.
On the Dashboard variables tab, anyone with dashboard write permissions can add, delete, and edit dashboard variables and their settings. These variables affect all mirrors that don’t have variable customizations applied.
If you want to override the dashboards default variables with no variables, you can leave the value blank. Doing so means you are overriding the dashboard variable default value with a setting of “no default value”.


