Part 1: Connect with your AWS services 🔗
Install the AWS integration and connect your AWS services with Splunk Observability Cloud. For an overview of the tutorial, see Tutorial: Monitor your AWS environment in Splunk Observability Cloud.
Connect with AWS 🔗
Send Amazon Web Services data to Splunk Observability Cloud using polling (default), which you can set up using the Splunk Observability Cloud UI guided install. Optionally, you can use the Splunk Observability Cloud API.
Alternatively, you can opt for data streaming (Splunk-managed), data streaming (AWS-managed), or to configure the connection using Splunk Terraform.
Poll AWS data using the UI 🔗
To access the guided setup for the AWS integration:
Log in to Splunk Observability Cloud.
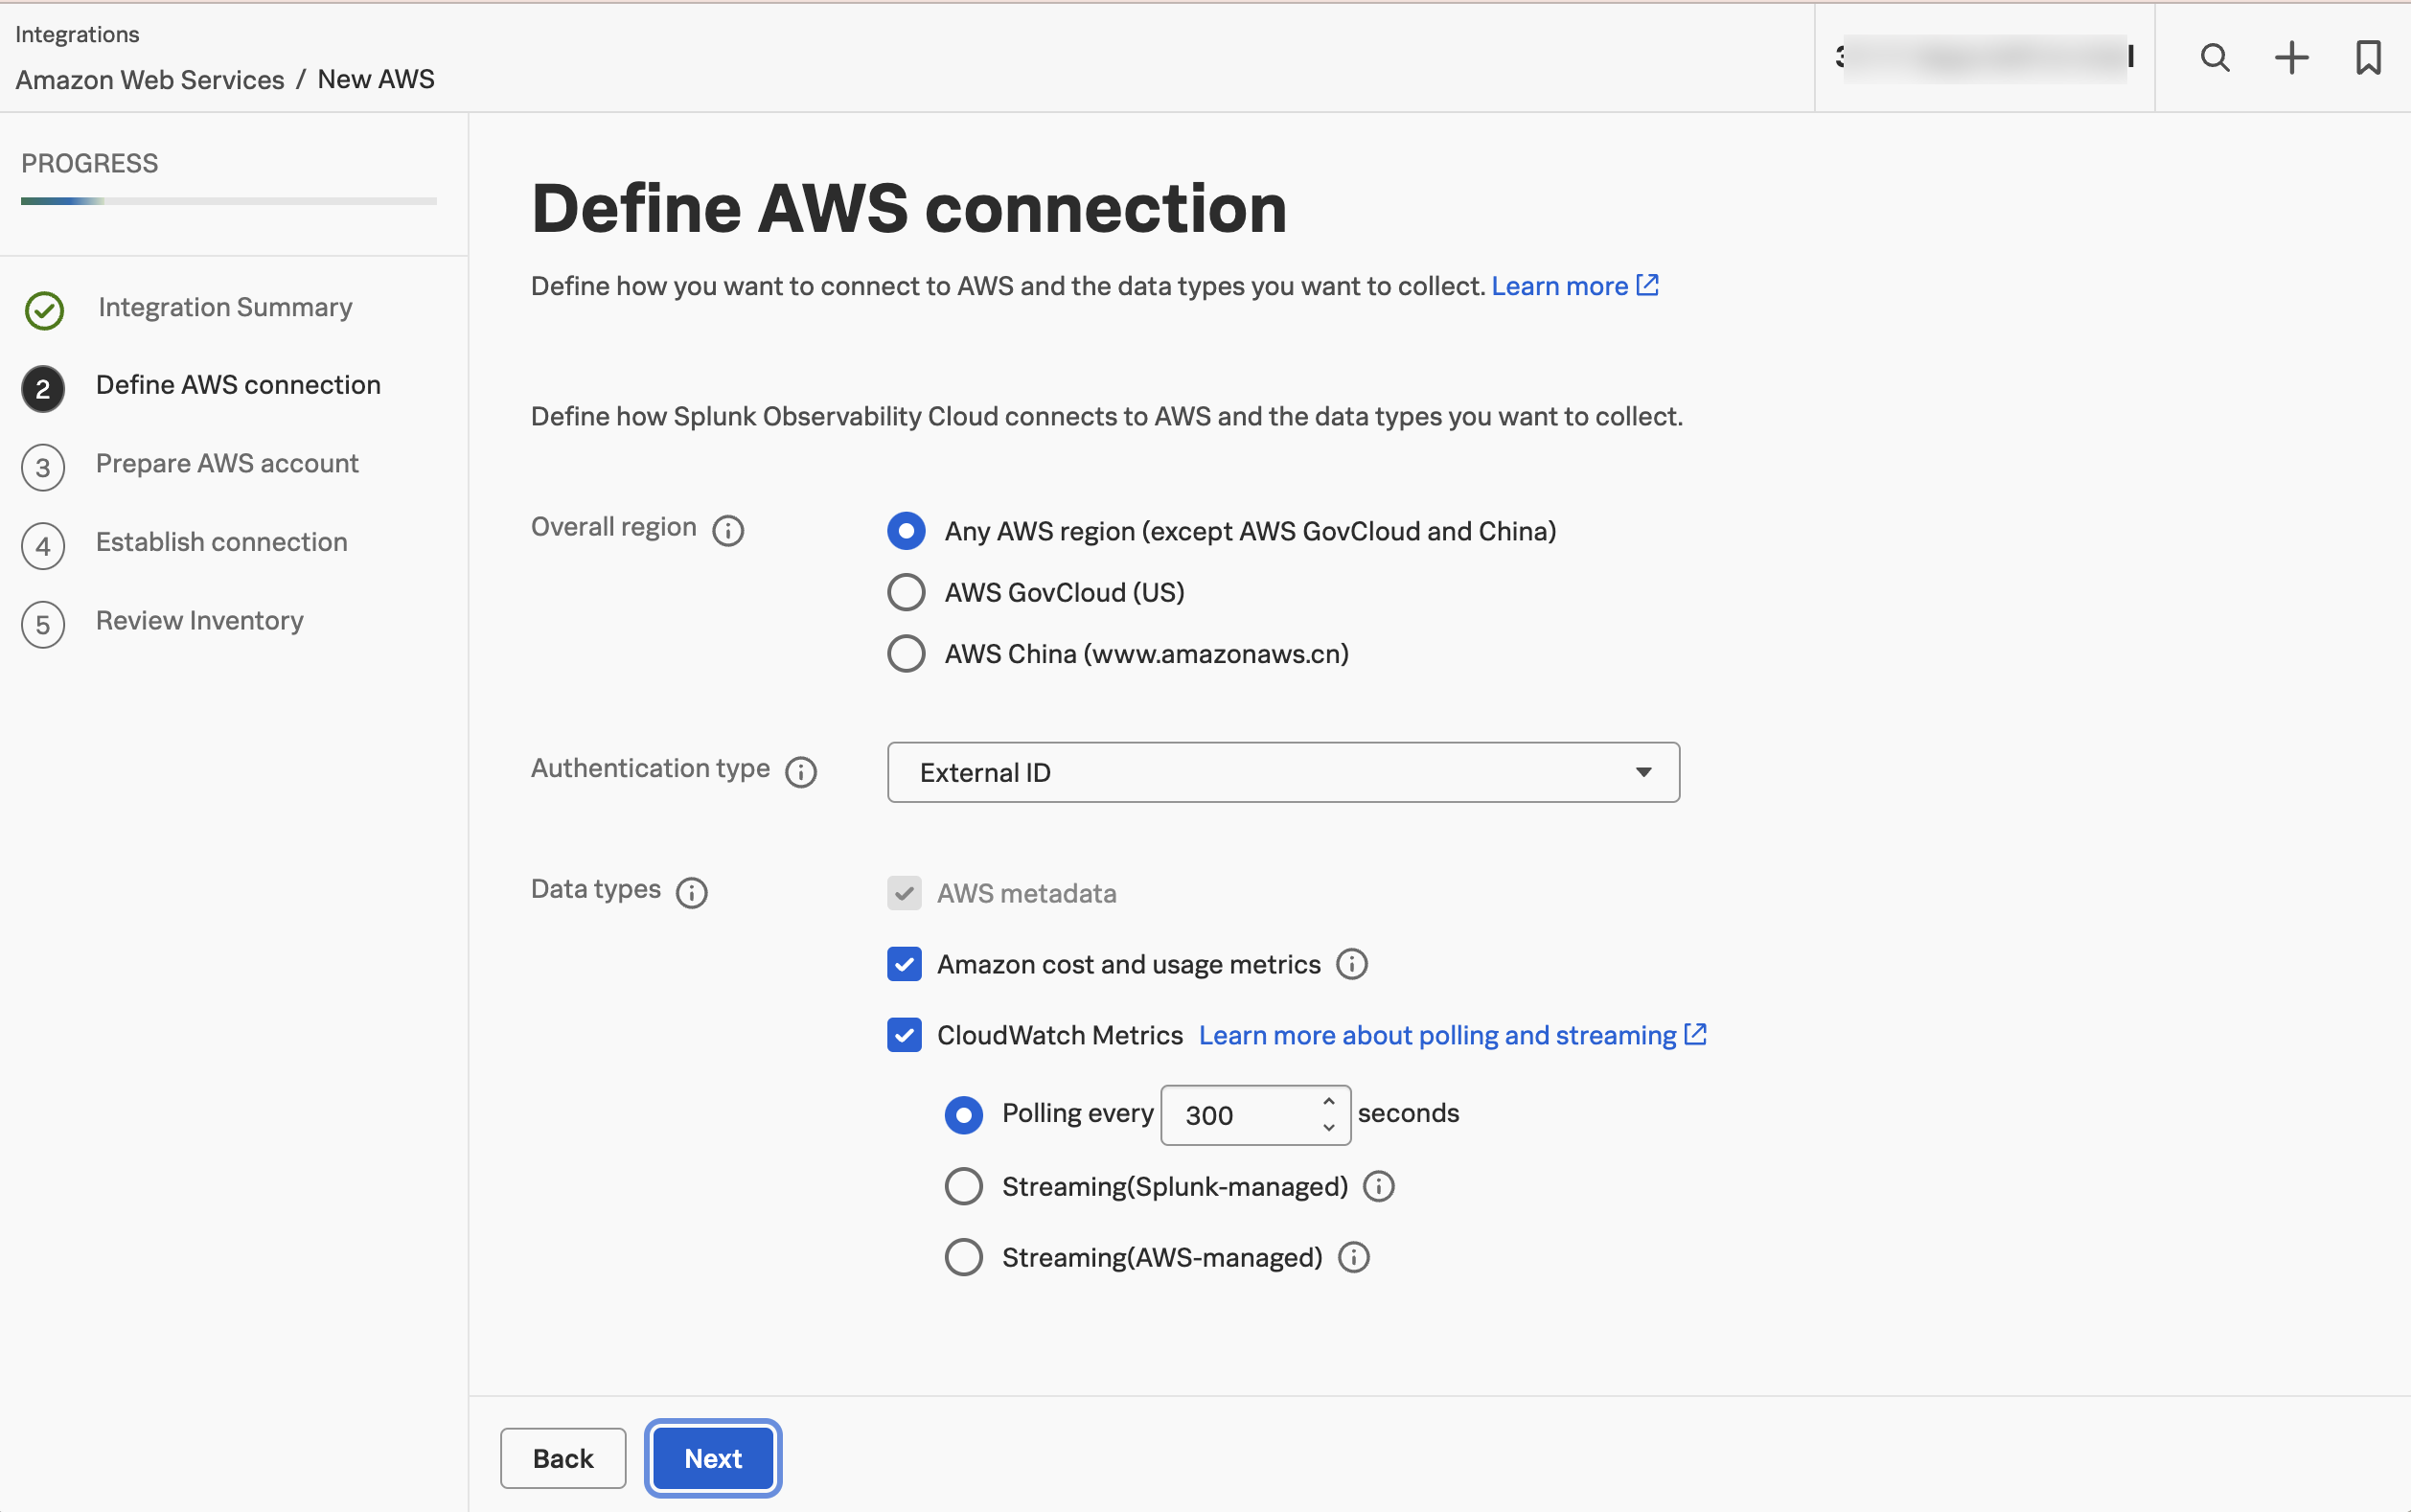
In the navigation menu, select , , then . The following window displays:

Configure the following connection options:
Overall region: The AWS region from which AWS manages your resources. For more information, see Supported AWS regions.
Authentication type: How you authenticate to connect with AWS. Learn more at Authenticate in AWS using an External ID (recommended).
Data types: The types of data and metadata to ingest.
In the CloudWatch Metrics option, select Polling as the ingestion method, and set up the polling rate at which you want Splunk Observability Cloud to poll CloudWatch for metric data.
Your data sources: AWS Regions and services.

For details on each step, read Connect to AWS via polling from the Splunk console.
Available AWS services 🔗
To monitor the specific services you’re using, check the list of AWS integrations available in Splunk Observability Cloud.
For the list of metrics provided by each service, see the AWS official documentation .
Install the OpenTelemetry Collector to send server and cluster data (Optional) 🔗
Optionally, you can install the Splunk Distribution of OpenTelemetry Collector on any hosts or clusters you’re using as a part of your infrastructure to send metrics to Infrastructure Monitoring, traces to APM, or logs to the Splunk Platform.
One of the benefits of using the Splunk Distribution of OpenTelemetry Collector to send your data to Splunk Observability Cloud is that Related Content, a feature that activates users to seamlessly move between key views in Splunk Observability Cloud, is easier to implement. For more information, see Related Content in Splunk Observability Cloud.
Next step 🔗
This completes the first part of the tutorial. You’ve connected your AWS services with Splunk Observability Cloud
Next, learn how to monitor your AWS data and services. To continue, see Part 2: Monitor and use AWS data in Splunk Observability Cloud.
Learn more 🔗
For more details about alternative ways to connect with AWS, see Compare AWS connection options.