Part 2: Monitor and use AWS data in Splunk Observability Cloud 🔗
Now that you’ve integrated with your AWS services, you can access your data using navigators and dashboards, search your AWS data, and set up detectors and alerts. For an overview of the tutorial, see Tutorial: Monitor your AWS environment in Splunk Observability Cloud.
View and manage AWS data 🔗
You can access and view your AWS data with a variety of tools:
View AWS metrics in built-in dashboards 🔗
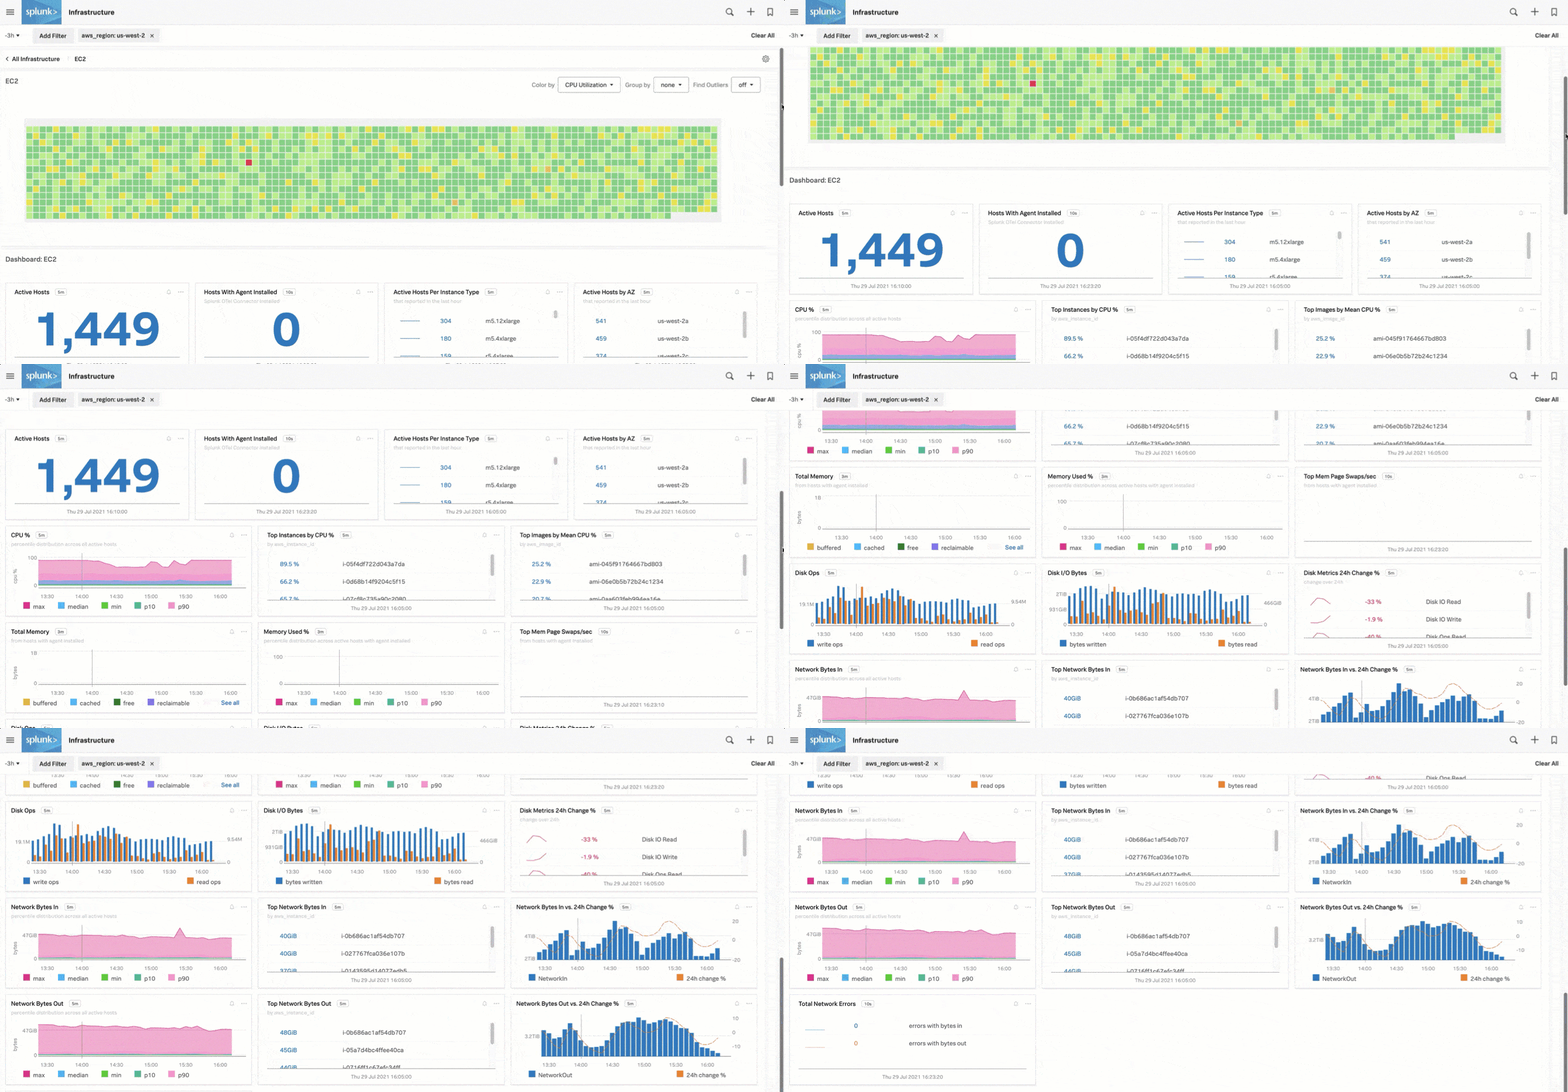
Splunk Observability Cloud also provides built-in dashboards that you can use to explore your Amazon Web Services data.
To access these dashboards:
In the left-side navigation menu, select .
Search for AWS to display the available Amazon Web Services dashboard groups.
Select the relevant dashboard link.
Search for AWS data 🔗
You can search for specific metrics using Metric Finder and for metadata using the metadata catalog.
Manage your metrics with metrics pipeline management 🔗
Use metrics pipeline management to centrally manage metric cardinality and control how you ingest and store your metrics, so you can lower costs and improve monitoring performance.
Create detectors to issue alerts 🔗
With alerts you can stay informed about certain conditions in your data.
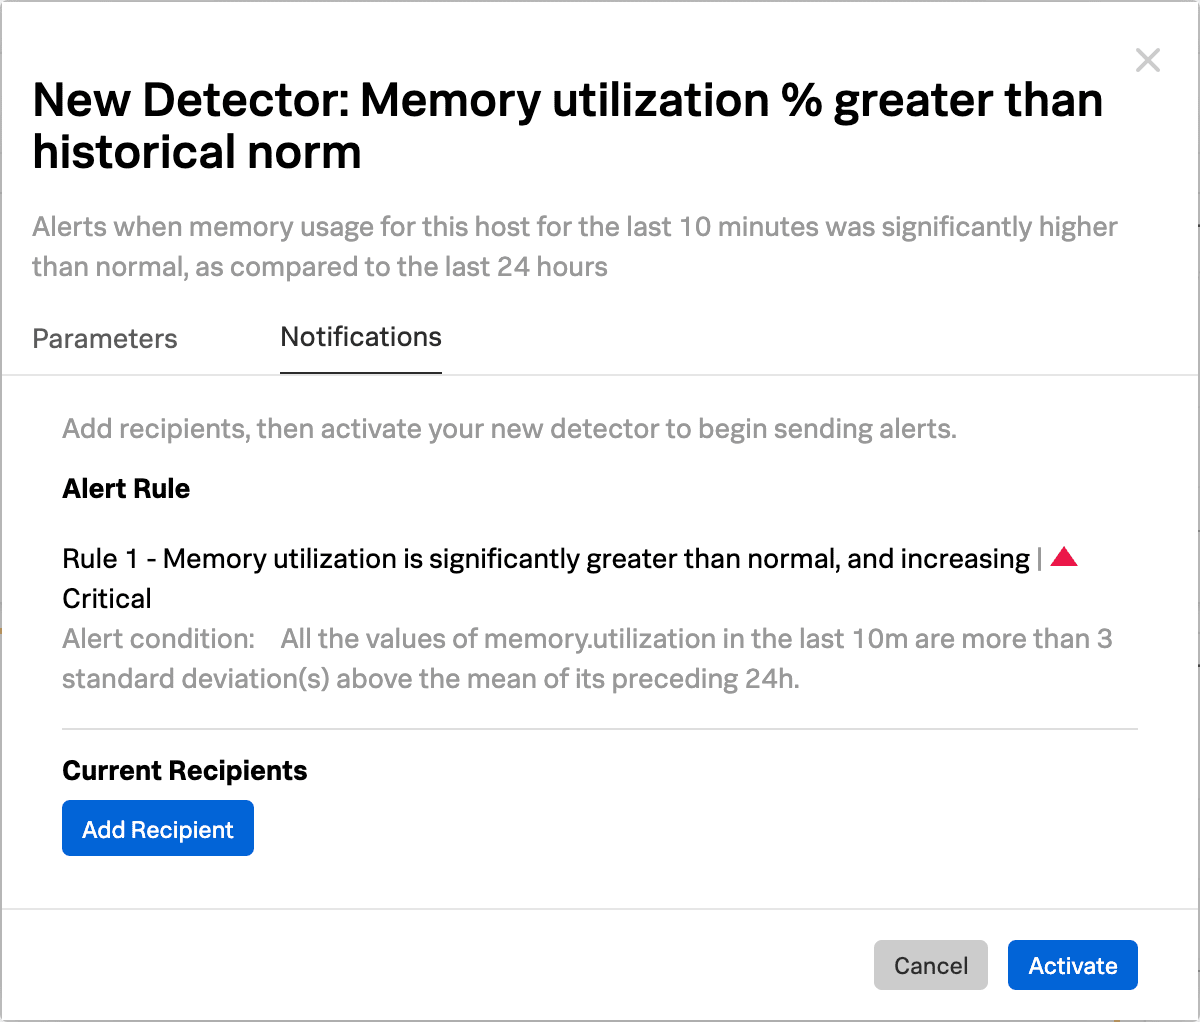
To create an alert, you first create a detector that monitors your data for the conditions you want to be alerted about. When such a condition is met, the detector issues an alert.
To set up an alert, follow these steps:
Access the chart you want to create a detector from.
Select the Get Alerts icon in the upper right of a chart.
The New Detector panel displays. Select Add Recipient to add the location where you want to receive the alert such as an email, a Splunk Observability Cloud team, or a webhook.
Select Activate. When the data condition is met, Splunk Observability Cloud sends a notification to the designated recipients and displays alerts on the Alerts page.
Next steps 🔗
This concludes the tutorial. You’ve connected your AWS services with Splunk Observability Cloud, viewed your data with navigators and dashboards, searched your AWS data, and created a detector.
Learn more 🔗
For more details about the concepts discussed in this part of the tutorial:
For ideas about what to learn next:
To learn how to create custom dashboards, see Create and customize dashboards and Best practices for creating dashboards in Splunk Observability Cloud.
To learn how to jump between components of Splunk Observability Cloud by selecting related data, see Related Content in Splunk Observability Cloud.
To learn about additional data sources that you can monitor using Splunk Observability Cloud, see Supported integrations in Splunk Observability Cloud.
To learn how to coordinate team efforts in Splunk Observability Cloud using team alerts and dashboards, see Create and manage teams in Splunk Observability Cloud
To learn more about the concepts used in this tutorial and Splunk Observability Cloud in general, see Splunk Observability Cloud overview.


