Monitor applications with Prometheus metrics 🔗
The Prometheus receiver allows the Splunk Distribution of the OpenTelemetry Collector to collect metrics from any source exposing telemetry in Prometheus format. See Prometheus receiver to learn more.
Benefits 🔗
By default, the Splunk Distribution of the OpenTelemetry Collector includes the Prometheus receiver in the metrics/internal pipeline when deployed in host monitoring (agent) mode. See Collector deployment modes for more information.
This receiver and pipeline enable the collection of the Collector’s internal metrics, such as data loss, ingress, egress, that power the built-in Collector dashboard.
Scrape any service that emits metrics in Prometheus format 🔗
You can also use the Prometheus receiver to connect Splunk Observability Cloud with any service that can export their existing data as Prometheus metrics. See a complete list of third-party applications compatible with Prometheus in Prometheus’ official documentation at Prometheus exporters .
Configure the Prometheus receiver to scrape metrics from a third-party app: Apache Flink 🔗
This example steps through how to scrape data from Apache Flink, which processes data streams at a large scale and analyzes your app’s processed data real-time, as Prometheus metrics with the Collector. Learn more about Apache Flink .
Caution
Metrics collected using this configuration are custom metrics: they’re not supported by built-in content, and charges might apply. See more at Metrics in Splunk Observability Cloud.
To scrape Flink’s data as Prometheus metrics with the Collector:
Configure Flink to expose data as Prometheus metrics.
Flink uses port
9249by default. If necessary, edit the Flink configuration file to enable the Prometheus endpoint to expose metrics there. See Apache’s official documentation to learn how .Deploy the Splunk Distribution of OpenTelemetry Collector to your host or container platform:
Configure the Prometheus receiver as described in the Sample configurations section.
(Optional) Limit data ingest.
These services have massive cardinality and might generate thousands of MTS per instance. To reduce the amount of data to ingest, see Control data to ingest using the Collector.
Restart the Collector.
Sample configurations 🔗
Configure the Prometheus receiver with Apache Flink:
prometheus/flink:
   config:
      scrape_configs:
         - job_name: 'apache-flink'
         scrape_interval: 10s
         static_configs:
            - targets: ['0.0.0.0:9249']
Next, activate the metrics pipeline:
metrics:
   receivers: [hostmetrics, otlp, signalfx, prometheus/flink]
Settings 🔗
The following table shows the configuration options for the Prometheus receiver:
Next steps 🔗
You can now see your Apache Flink metrics in Splunk Observability Cloud.

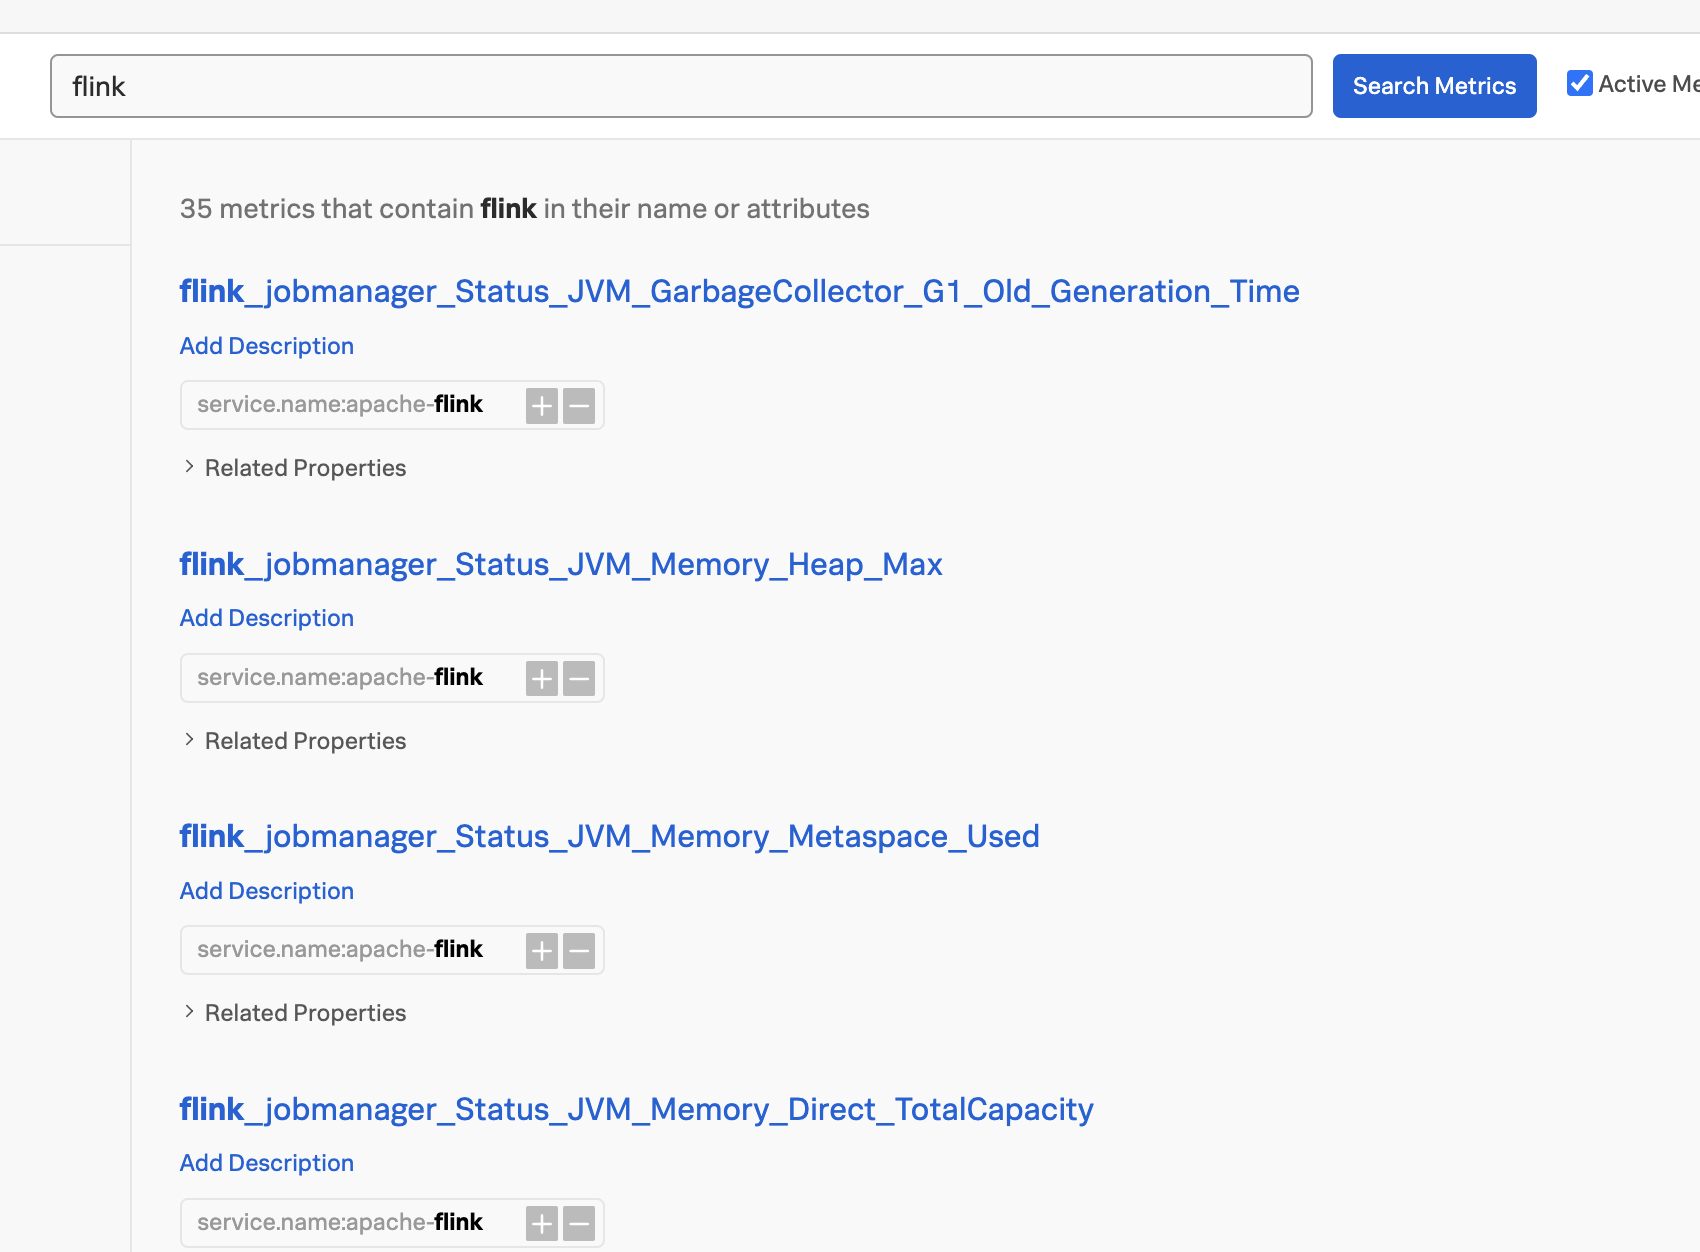
Use the metric finder to find, view, and edit Flink metrics. See how at Search the Metric Finder and Metadata Catalog.
Create custom dashboards to visualize metrics. Learn how at Create and customize dashboards.
Troubleshooting 🔗
If you are a Splunk Observability Cloud customer and are not able to see your data in Splunk Observability Cloud, you can get help in the following ways.
Available to Splunk Observability Cloud customers
Submit a case in the Splunk Support Portal .
Contact Splunk Support .
Available to prospective customers and free trial users
Ask a question and get answers through community support at Splunk Answers .
Join the Splunk #observability user group Slack channel to communicate with customers, partners, and Splunk employees worldwide. To join, see Chat groups in the Get Started with Splunk Community manual.