Activate a built-in detector to issue alerts 🔗
Now that you have data flowing into Splunk Observability Cloud and you can explore that data using navigators and dashboards, you can set up an alert that can help keep you informed about certain conditions in your data.
To create an alert, first create a detector that monitors data for conditions you want to be alerted about. When a condition you want to be alerted about is met, the detector issues an alert.
Access the chart you want to create a detector from. This example creates a detector based on the Memory Used % chart.
Select the Get Alerts icon in the upper right of a chart. Some chart data have built-in templates that make it easy for you to create detectors for useful alert conditions. For example, in the Memory Used % chart, there is a detector template called Memory utilization % greater than historical norm.
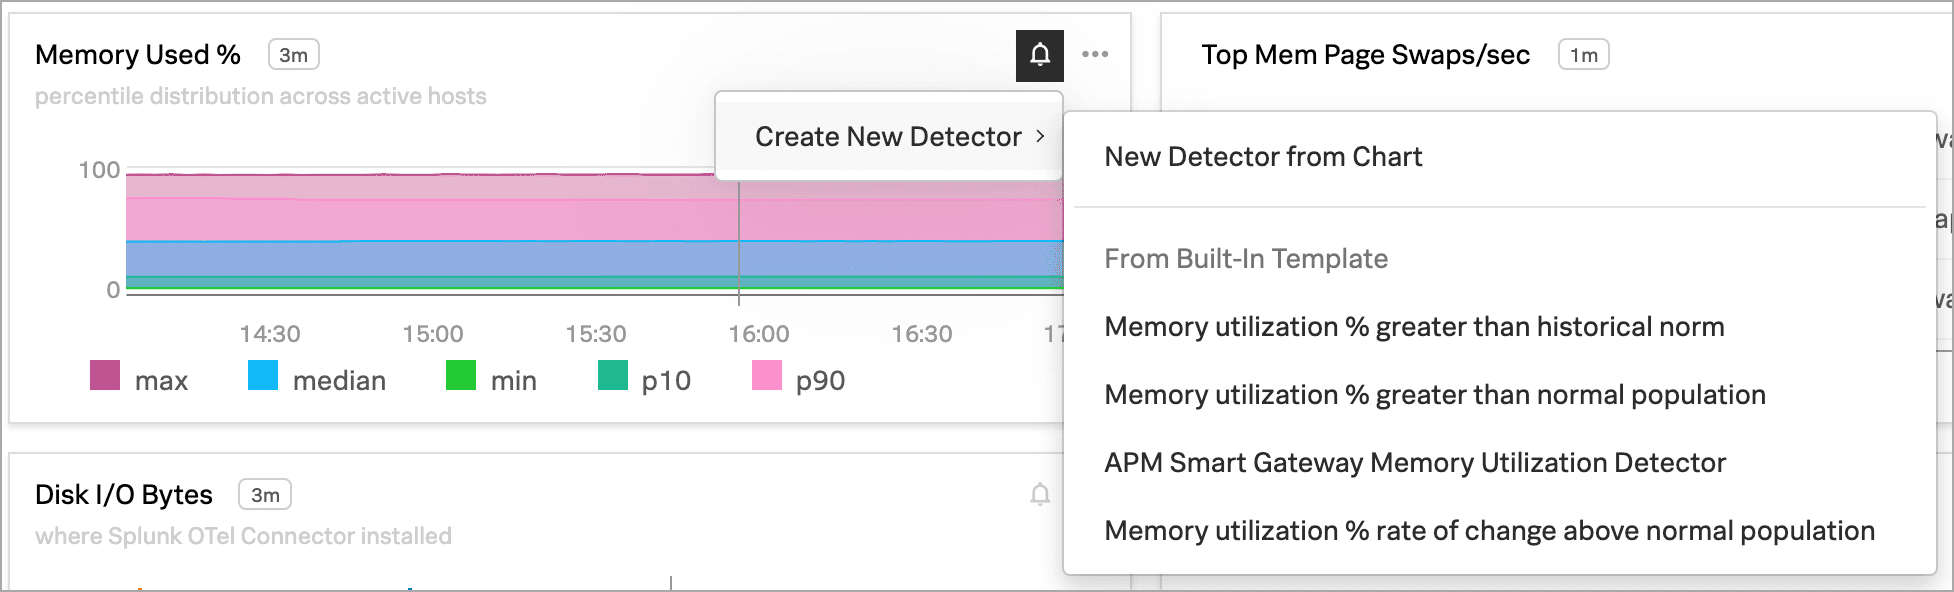
This detector sends an alert when memory usage for the last 10 minutes was significantly higher than normal, as compared to the last 24 hours.
The New Detector panel displays. Select Add Recipients to add an email, Splunk Observability Cloud team, or webhook that you want to receive the alert. See Create and manage teams in Splunk Observability Cloud and Send alert notifications to a webhook using Splunk Observability Cloud to learn more.
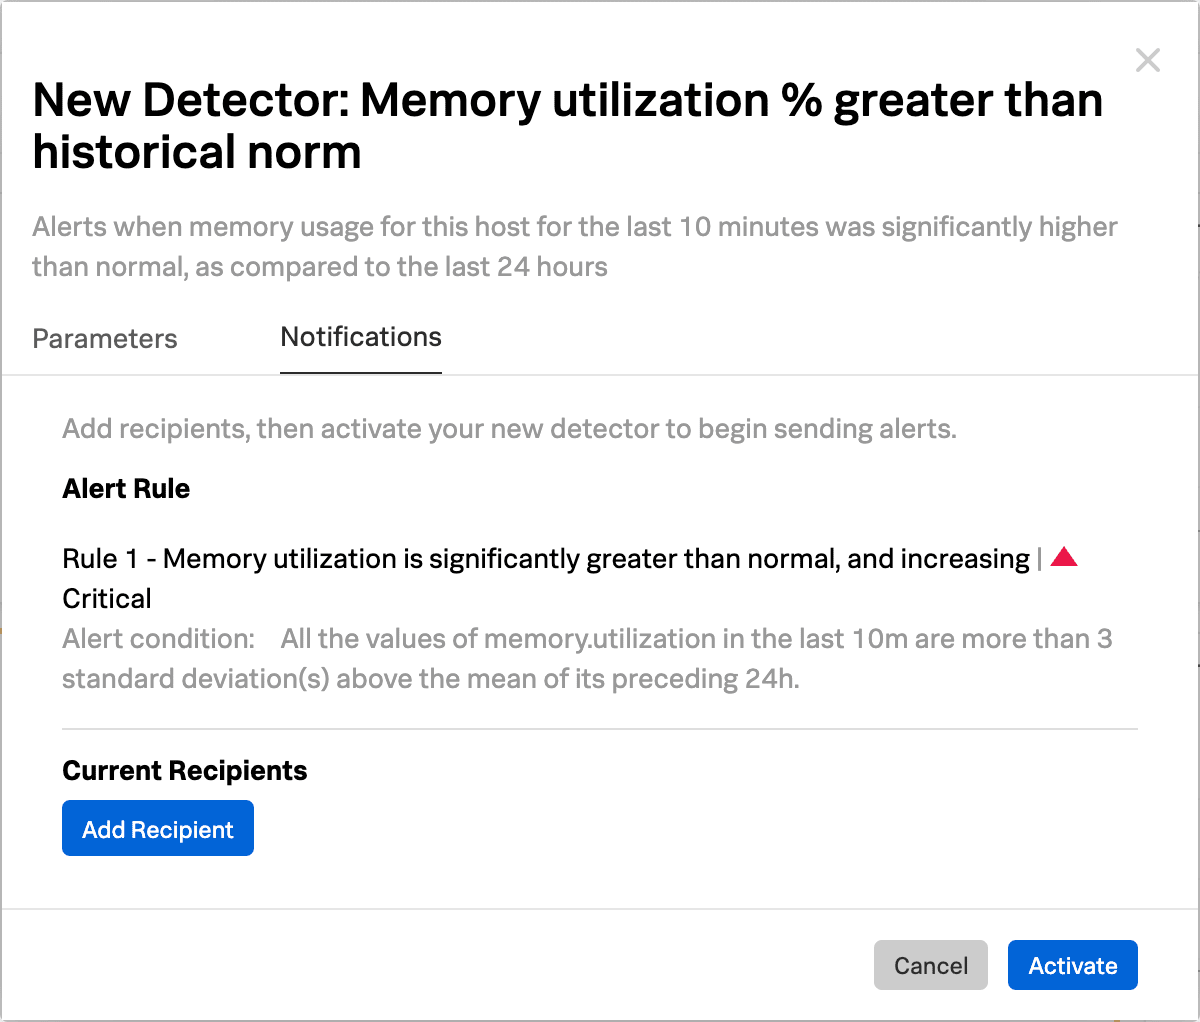
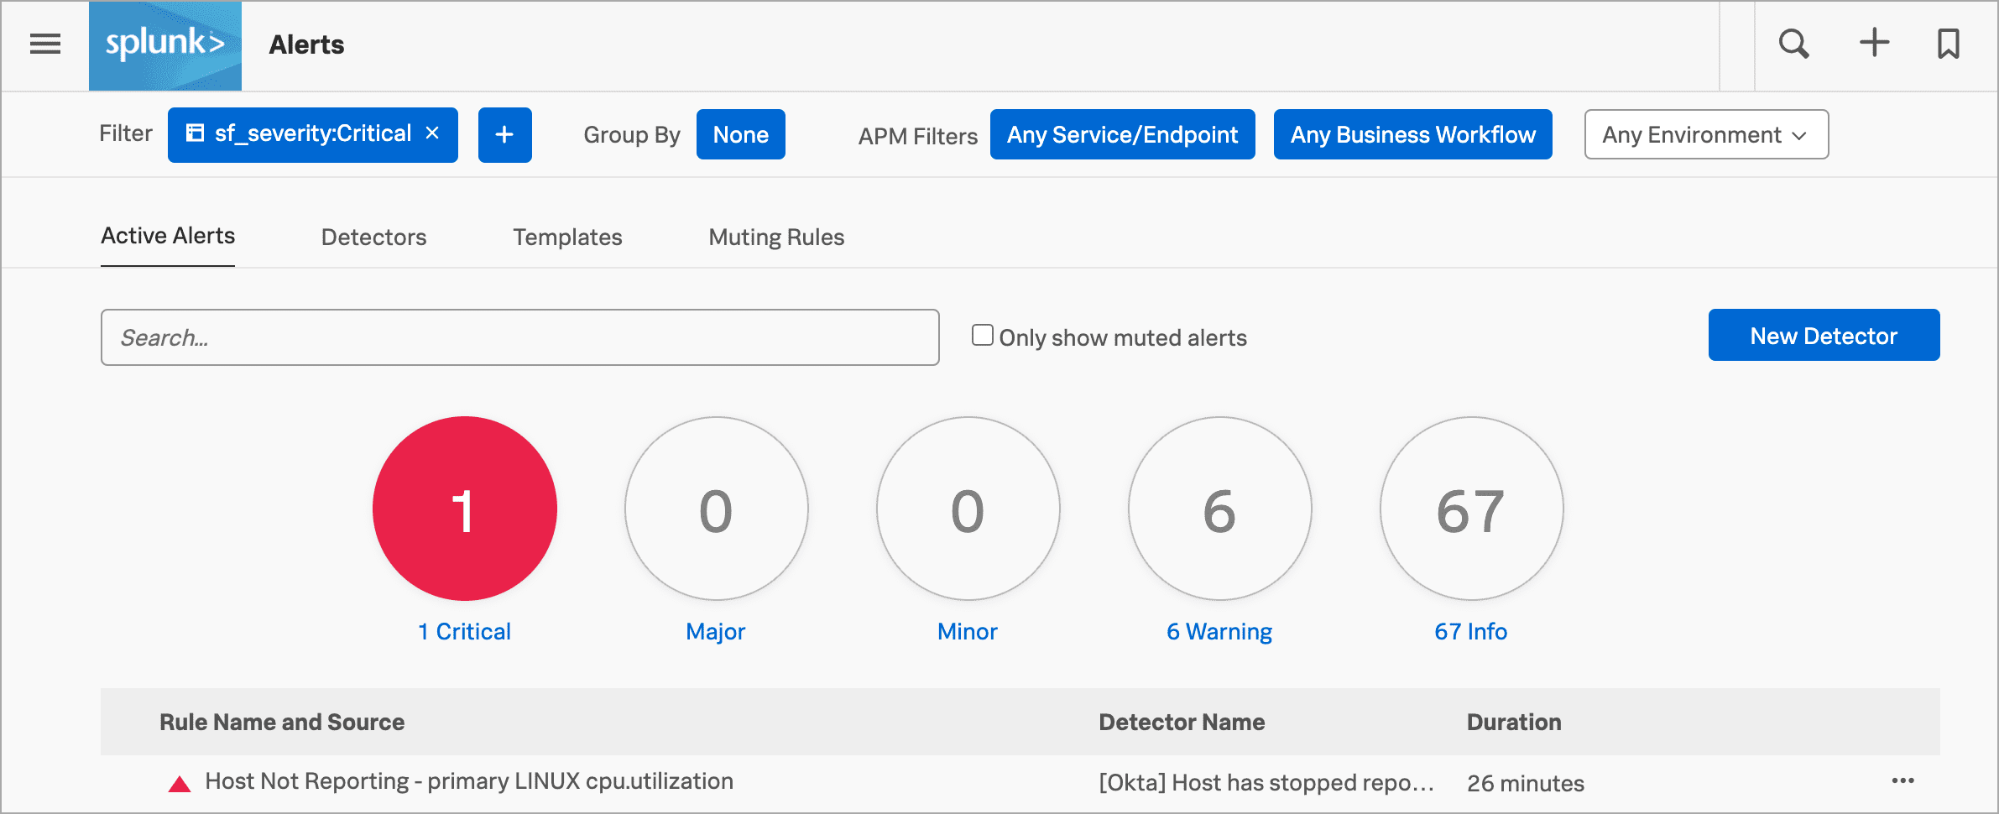
Select Activate. When the data condition is met, Splunk Observability Cloud sends a notification to designated recipients and displays alerts on the Alerts page.
For more details about alerts and detectors, see Introduction to alerts and detectors in Splunk Observability Cloud.
Additional resources 🔗
This completes the tutorial.
To learn more about concepts in this tutorial, such as managing dashboards and teams, see Welcome to Splunk Observability Cloud.