Monitor your Kubernetes cluster 🔗
Now that you have data about your Kubernetes cluster flowing into Splunk Observability Cloud, you can use built-in navigators to explore your data.
Prerequisites 🔗
Navigators appear only if Splunk Infrastructure Monitoring is receiving data from your source.
For example, even if a guided setup you used in Install the Collector and get Kubernetes data into Splunk Observability Cloud or in this task provided confirmation of a valid connection, the navigators don’t display unless your host, Kubernetes cluster, or cloud provider service is actively sending data to Splunk Infrastructure Monitoring.
If you don’t see a navigator after 15 minutes of making a valid connection, check your source to ensure that it is generating data. For example, ensure that your host, cluster, or service is being used in a way that generates data that it can send to Splunk Infrastructure Monitoring.
Tips for working with navigators 🔗
Navigators are primarily composed of charts.
Using charts, you can view details about your metrics and visualize metric time series.
Hover over a chart to see details about specific metric time series.
Select within a chart to see the data table for a given time period.
Select a chart title in the top left of a chart to display the full chart along with more chart options, such as a plot editor and the ability to change the chart’s visualization type to area, column, or histogram.
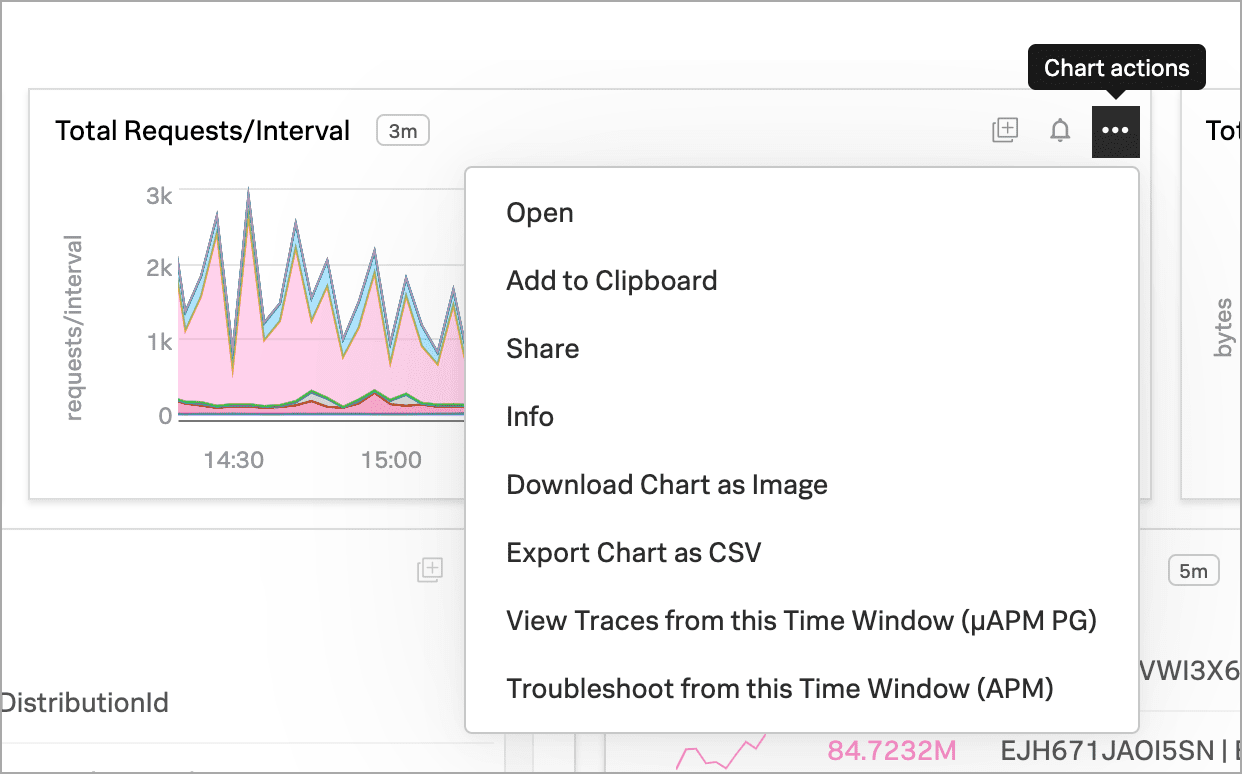
Every chart has a Chart Actions menu. Select the more (⋯) icon in the upper right of a chart to open the menu and view available actions. For example, you can share the chart, download it as an image, or export it as a comma-separated values (CSV) file.
For more details about using navigators, see Use navigators in Splunk Infrastructure Monitoring.
For more details about working with charts, see Charts in Splunk Observability Cloud.
Monitor Kubernetes clusters using the Kubernetes navigator 🔗
After installing the Splunk Distribution of OpenTelemetry Collector, explore your cluster’s data using the Kubernetes navigator.
Log in to Splunk Observability Cloud.
In the left navigation menu, select Infrastructure.
In the Containers section, select Kubernetes.
Select a Kubernetes service, such as Kubernetes nodes. The Kubernetes navigator displays.
Note
By default, Kubernetes clusters are separated by service. To see a map of all Kubernetes clusters, select Switch to classic navigator.

To filter the data shown in the navigator to a specific cluster, such as the one you installed the Splunk Distribution of OpenTelemetry Collector in, set the Cluster value to the cluster name you provided.
For more details about the data displayed in the Kubernetes navigator, see Use the Kubernetes navigator.
Explore Kubernetes data using built-in dashboards 🔗
Splunk Observability Cloud also provides built-in dashboards that you can use to explore your Kubernetes data. See Dashboards in Splunk Observability Cloud to see which built-in dashboards are available.
To access these dashboards, follow these steps:
Open the navigation Menu and select Dashboards. The Dashboards page displays.
Search for Kubernetes. The Kubernetes dashboard group displays.
Select a link to access a relevant dashboard.
Next step 🔗
This completes the second part of the tutorial.
To learn how to create a built-in detector to alert you about your Kubernetes data, continue to Activate a built-in detector to issue alerts.