Install the Collector and get Kubernetes data into Splunk Observability Cloud 🔗
Install the Splunk Distribution of OpenTelemetry Collector in a Kubernetes cluster to start getting platform infrastructure data into Splunk Observability Cloud. After this data starts flowing into Splunk Observability Cloud, you can take these actions:
Monitor your platform infrastructure data using navigators.
Activate a built-in detector to issue alerts about specific conditions in your data.
Note
To ensure a seamless flow from this task to Monitor your Kubernetes cluster, make sure that your infrastructure host or cluster is generating data that Splunk Observability Cloud can receive. For example, even if a guided setup you use in this task provides a confirmation of a valid connection, the navigators don’t appear unless your infrastructure is actively sending data to Splunk Infrastructure Monitoring.
Get Kubernetes data into Splunk Observability Cloud 🔗
Log in to Splunk Observability Cloud.
Select the Add Integration button or in the left navigation menu, select Data Management to open the Integrate Your Data page.
Select Deploy the Splunk OpenTelemetry Collector, and select Next. The Install Configuration screen displays.
In the Platform menu, select Kubernetes. The setup guide opens.
Enter the values applicable to your environment to configure the Collector instance.
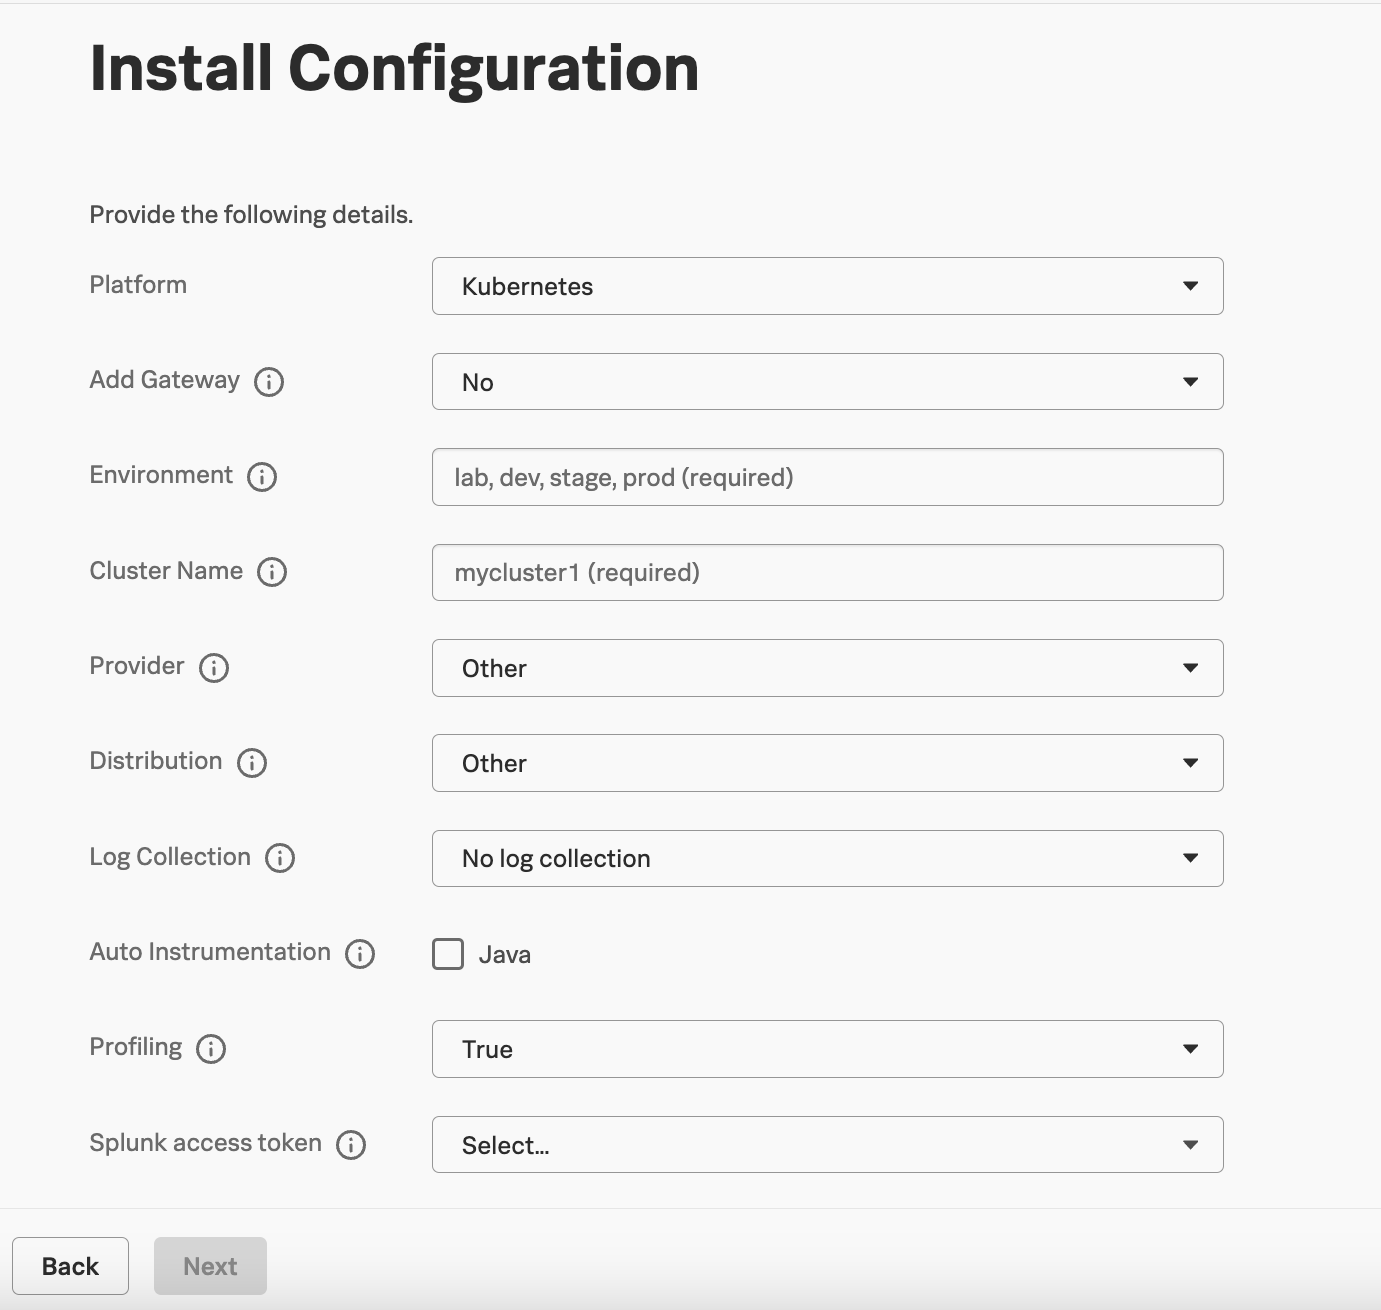
6. Select Next. The Installation Instructions screen displays. Based on your entries in the Configure Integration screen, the guided setup provides commands that you can copy and paste to install the Splunk Distribution of OpenTelemetry Collector on your selected platform.

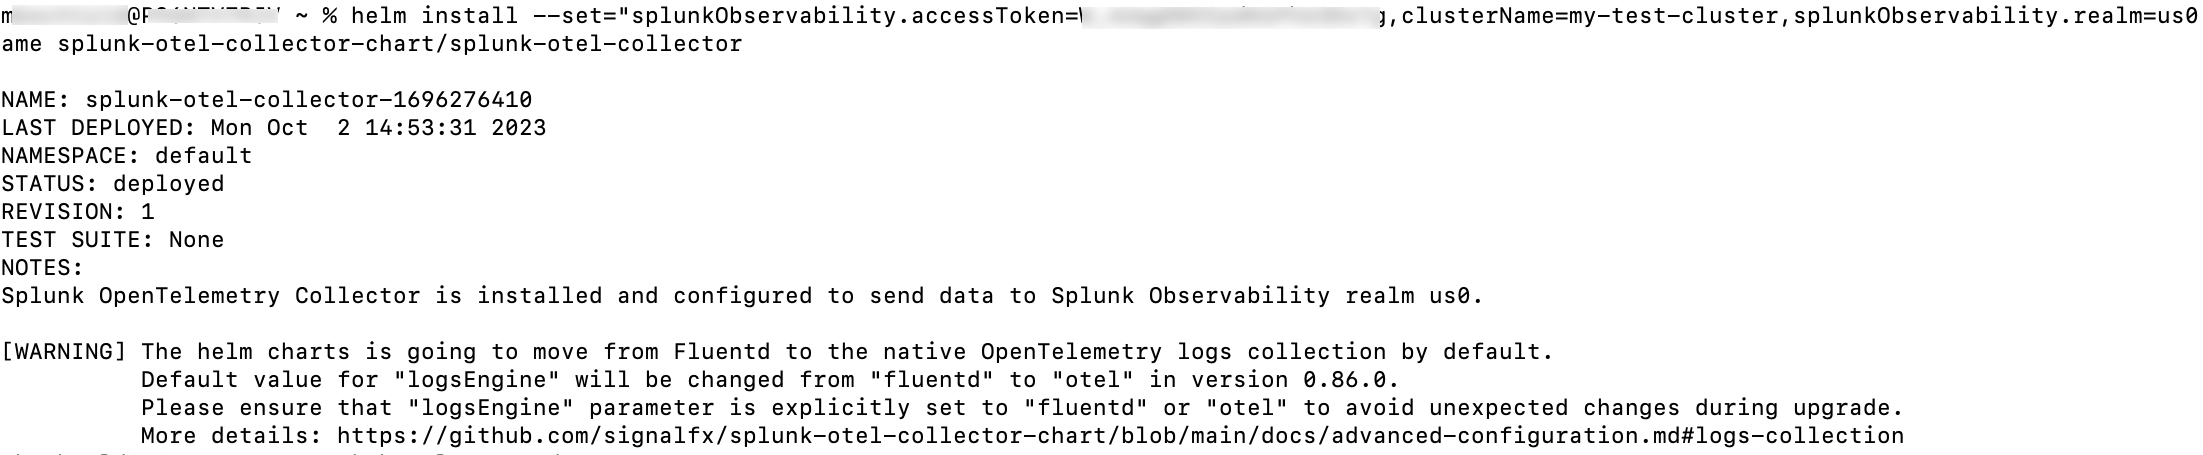
Start your Kubernetes cluster, and use the commands from the Configure Integration to deploy the Splunk Distribution of OpenTelemetry Collector. The following image shows a successful installation of the Collector:
Once you have deployed the Collector, return to the Configure Integration screen and select Next. The Review Inventory screen shows a summary of your Kubernetes data.

(Optional) Select Explore Metric Data to further interact with your data.
Next step 🔗
This completes the first step of the tutorial.
To learn how to monitor your Kubernetes data using built-in dashboards and navigators, continue to Monitor your Kubernetes cluster.