Set up Network Explorer in Kubernetes 🔗
Note
While Splunk Observability Cloud fully supports the Network Explorer navigator, the upstream OpenTelemetry eBPF Helm chart is not covered under official Splunk support. Any feature updates, security, or bug fixes to it are not bound by any SLAs.
If you wish to continue using Network Explorer to see data in Splunk Observability Cloud, point the upstream eBPF Helm chart to the OpenTelemetry Collector running as a gateway.
You can install and configure Network Explorer as part of the Splunk Distribution of the OpenTelemetry Collector Helm chart. You also need the OpenTelemetry Collector eBPF Helm chart.
Prerequisites 🔗
To use Network Explorer with Kubernetes, you must meet the following requirements:
Prerequisite |
Description |
|---|---|
Environment |
Network Explorer is supported in Kubernetes-based environments on Linux hosts. Use Helm-based management. |
Operating system |
|
Kubernetes version |
Network Explorer requires Kubernetes 1.24 or higher. For more information, see Releases in the Kubernetes documentation. |
Helm version |
Network Explorer requires Helm version 3.9 or higher. |
Note
Network Explorer is not compatible with GKE Autopilot clusters.
To use Network Explorer with OpenShift, you must meet the following requirements:
Prerequisite
Description
OpenShift version
An on-premises OpenShift cluster or an OpenShift Rosa cluster version 4.12.18 or 4.12.13
Admin role
You must be an admin in Splunk Observability Cloud to install Network Explorer on OpenShift
Network Explorer components 🔗
The Helm chart for Network Explorer consists of the following components:
Component
Description
Required?
On by default?
The reducer
The reducer takes the data points collected by the collectors and reduces them to actual metric time series (MTS). The reducer also connects to the Splunk Distribution of OpenTelemetry Collector on the OTLP gRPC port.
Yes. Install and configure at least 1 instance of the reducer.
Yes
The kernel collector
The Extended Berkeley Packet Filter (eBPF) agent responsible for gathering data points from the kernel.
Yes. Install and configure the kernel collector on each of your hosts.
Yes
The Kubernetes collector
The Kubernetes collector further enriches collected data points with additional metadata.
No. If you want to get additional metadata, install and configure at least one instance of the Kubernetes collector on each Kubernetes cluster.
Yes. If you want to turn off the Kubernetes collector, set
k8sCollector.enabledtofalse.The cloud collector
The cloud collector further enriches collected data points with additional metadata.
No. If your Kubernetes is hosted by, or installed within, AWS, and you want to get additional metadata, install and configure at least 1 instance of the cloud collector.
No. If you want to turn on the cloud collector, set
cloudCollector.enabledtotrue.
Install Network Explorer 🔗
To collect and send network data to Network Explorer, you need to install two separate Helm charts, the Splunk OpenTelemetry Collector Helm chart and the OpenTelemetry Collector eBPF Helm chart.
Install the Collector Helm chart 🔗
For the Splunk Distribution of OpenTelemetry Collector to work with Network Explorer, you must install it in data forwarding (Gateway) mode and with the following settings:
Turn on OTLP gRPC reception by configuring an OTLP gRPC metric receiver on the Gateway.
Turn on SignalFx export by configuring a SignalFx exporter on the Gateway with the valid realm and access token.
The OTLP gRPC metric receiver and SignalFx exporter are already configured in the Helm chart for the Splunk Distribution of OpenTelemetry Collector, so if you use the Helm chart method to install the Splunk Distribution of OpenTelemetry Collector, you don’t need to configure these requirements separately. See Install the Collector for Kubernetes using Helm for detailed instructions.
The following table shows required parameters for this installation:
Parameter
Description
gatewayActivates data forwarding (Gateway) mode, which is required by Network Explorer.
namespaceKubernetes namespace to install into. This value must match the value for the namespace of the Network Explorer.
splunkObservability.realmSplunk realm to send telemetry data to. For example,
us0.
splunkObservability.accessTokenAccess token for your organization. An access token with ingest scope is sufficient. For more information, see Create and manage organization access tokens using Splunk Observability Cloud.
clusterNameAn arbitrary value that identifies your Kubernetes cluster.
agent.enabled
If you are adding Network Explorer to an existing Splunk Distribution of OpenTelemetry Collector configuration, leave
agent.enabledas is.If you are installing a new instance of the Splunk Distribution of OpenTelemetry Collector and only want to collect telemetry from Network Explorer, set this to
falseto turn off installing the Splunk Distribution of OpenTelemetry Collector in host monitoring (agent) mode on each Kubernetes node.If you are installing a new instance of the Splunk Distribution of OpenTelemetry Collector and want to collect telemetry from both Network Explorer and the individual OpenTelemetry Collector agents, set this to
true.
clusterReceiver.enabled
If you are adding Network Explorer to an existing Splunk Distribution of OpenTelemetry Collector configuration, leave
clusterReceiver.enabledas is.If you are installing a new instance of the Splunk Distribution of OpenTelemetry Collector and only want to collect telemetry from Network Explorer, set this to
falsesince Network Explorer doesn’t usesplunk-otel-collector-k8s-cluster-receiver.If you are installing a new instance of the Splunk Distribution of OpenTelemetry Collector and want to collect cluster-level metrics from the Kubernetes API server in addition to Network Explorer telemetry, set this to
true.
gateway.replicaCountSet this to
1since Network Explorer doesn’t support communication to multiple gateway replicas.
Note
Starting from version 0.88 of the Helm chart, the networkExplorer setting of the Splunk OpenTelemetry Collector Helm chart is deprecated. For instructions on how to migrate from the networkExplorer setting to the eBPF Helm chart, see Migrate from networkExplorer to eBPF Helm chart.
Install the eBPF Helm chart 🔗
After you’ve deployed the Splunk Distribution of the OpenTelemetry Collector using the Helm chart, add the OpenTelemetry eBPF Helm chart by running these commands:
helm repo add open-telemetry https://open-telemetry.github.io/opentelemetry-helm-charts
helm repo update open-telemetry
helm install my-opentelemetry-ebpf -f ./otel-ebpf-values.yaml open-telemetry/opentelemetry-ebpf
Make sure that the otel-ebpf-values.yaml file has the endpoint.address option set to the Splunk OpenTelemetry Collector gateway service name. You can get the service name by running the following command:
kubectl get svc | grep splunk-otel-collector
See the OpenTelemetry Collector eBPF values file for more details.
The OpenTelemetry Collector eBPF Helm chart requires kernel headers to run the kernel in each Kubernetes node. The kernel collector installs the headers automatically unless your nodes don’t have access to the internet.
If you need to install the required packages manually, run the following command:
sudo apt-get install --yes linux-headers-$(uname -r)sudo yum install -y kernel-devel-$(uname -r)
Example: Install Network Explorer for Kubernetes 🔗
In this example, the reducer, the kernel collector, and the Kubernetes collector are configured together with the OpenTelemetry Collector eBPF Helm chart. The cloud collector isn’t turned on.
Deploy and update the Splunk OpenTelemetry Collector Helm chart:
helm repo add splunk-otel-collector-chart https://signalfx.github.io/splunk-otel-collector-chart
helm repo update
Install the Splunk Distribution of OpenTelemetry Collector. Replace the parameters with their appropriate values:
helm --namespace=<NAMESPACE> install my-splunk-otel-collector \
--set="splunkObservability.realm=<REALM>" \
--set="splunkObservability.accessToken=<ACCESS_TOKEN>" \
--set="clusterName=<CLUSTER_NAME>" \
--set="agent.enabled=false" \
--set="clusterReceiver.enabled=false" \
--set="gateway.replicaCount=1" \
splunk-otel-collector-chart/splunk-otel-collector
helm --namespace=<NAMESPACE> install splunk-otel-collector \
--set="splunkObservability.realm=<REALM>" \
--set="splunkObservability.accessToken=<ACCESS_TOKEN>" \
--set="clusterName=<CLUSTER_NAME>" \
--set="splunkObservability.logsEnabled=true" \
--set="splunkObservability.infrastructureMonitoringEventsEnabled=true" \
--set="agent.enabled=true" \
--set="clusterReceiver.enabled=true" \
--set="gateway.replicaCount=1" \
--set="environment=<APM_ENV>" \
--set="gateway.resources.limits.cpu=500m" \
--set="gateway.resources.limits.memory=1Gi" \
splunk-otel-collector-chart/splunk-otel-collector
Deploy and update the OpenTelemetry Collector eBPF Helm chart:
helm repo add open-telemetry https://open-telemetry.github.io/opentelemetry-helm-charts
helm repo update
Install the Splunk Distribution of OpenTelemetry Collector. Replace the parameters with their appropriate values:
helm --namespace=<NAMESPACE> install my-opentelemetry-ebpf \
    --set="endpoint.address=<Gateway Service Name>.<Gateway Service Namespace>.svc.cluster.local" \
    open-telemetry/opentelemetry-ebpf
For additional Splunk Distribution of OpenTelemetry Collector configuration, see Install the Collector for Kubernetes using Helm.
Example: Install Network Explorer for OpenShift 🔗
In this example, each node of an OpenShift cluster runs on Red Hat Enterprise Linux CoreOS, which has SELinux activated by default. To install the Network Explorer kernel collector, you have to configure Super-Privileged Container (SPC) for SELinux. Follow these steps to install Network Explorer:
Run the following script to modify the SELinux SPC policy to allow additional access to
spc_tdomain processes:tmp_dir=$(mktemp -d -t EBPF_NET-XXXXX) cat > "${tmp_dir}/spc_bpf_allow.te" <<END module spc_bpf_allow 1.0; require { type spc_t; class bpf {map_create map_read map_write prog_load prog_run}; } #============= spc_t ============== allow spc_t self:bpf { map_create map_read map_write prog_load prog_run }; END checkmodule -M -m -o "${tmp_dir}/spc_bpf_allow.mod" "${tmp_dir}/spc_bpf_allow.te" semodule_package -o "${tmp_dir}/spc_bpf_allow.pp" -m "${tmp_dir}/spc_bpf_allow.mod" semodule -i "${tmp_dir}/spc_bpf_allow.pp"
Run the following commands to deploy the Helm chart.
helm repo add splunk-otel-collector-chart https://signalfx.github.io/splunk-otel-collector-chart
Run the following command to update the Helm chart.
helm repo update
Run the following command to install the Splunk Distribution of OpenTelemetry Collector. Replace the parameters with their appropriate values.
helm --namespace=<NAMESPACE> install my-splunk-otel-collector \
--set="splunkObservability.realm=<REALM>" \
--set="splunkObservability.accessToken=<ACCESS_TOKEN>" \
--set="distribution=openshift" \
--set="clusterName=<CLUSTER_NAME>" \
--set="agent.enabled=true" \
--set="clusterReceiver.enabled=true" \
--set="gateway.replicaCount=1" \
splunk-otel-collector-chart/splunk-otel-collector
Deploy and update the OpenTelemetry Collector eBPF Helm chart:
helm repo add open-telemetry https://open-telemetry.github.io/opentelemetry-helm-charts
helm repo update
Install the Splunk Distribution of OpenTelemetry Collector. Replace the parameters with their appropriate values:
helm --namespace=<NAMESPACE> install my-opentelemetry-ebpf \
    --set="endpoint.address=<address_of_gateway>" \
    --set="podSecurityPolicy.enabled=false" \
    --set="rbac.create=true" \
    --set="k8sCollector.serviceAccount.create=true" \
    --set="kernelCollector.serviceAccount.create=true" \
    --set="kernelCollector.image.tag=4.18.0-372.51.1.el8_6.x86_64" \
    --set="kernelCollector.image.name=kernel-collector-openshift" \
    open-telemetry/opentelemetry-ebpf
The kernel collector pods need privileged access to function. Run the following command to configure privileged access for the kernel collector pods.
oc adm policy add-scc-to-user privileged -z my-opentelemetry-ebpf -n <NAMESPACE>
Run the following command to update the default security context constraints (SCC) for your OpenShift cluster, so that images are not forced to run as a pre-allocated User Identifier, without granting everyone access to the privileged SCC.
oc adm policy add-scc-to-user anyuid -z my-opentelemetry-ebpf -n <NAMESPACE>
Change the resource footprint of Splunk Distribution of the OpenTelemetry Collector 🔗
Each Kubernetes node has a Splunk Distribution of the OpenTelemetry Collector, so you might want to adjust your resources depending on the number of Kubernetes nodes you have.
You can update the Splunk Distribution of the OpenTelemetry Collector values file , or specify different values during installation.
These are the default resource configurations:
resources:
   limits:
      cpu: 4
      memory: 8Gi
Use the following approximations to determine your resource needs.
Approximation |
Resource needs |
|---|---|
Up to 500 nodes/5,000 data points per second |
CPU: 500m, memory: 1 Gi |
Up to 1,000 nodes/10,000 data points per second |
CPU: 1, memory: 2 Gi |
Up to 2,000 nodes/20,000 data points per second |
CPU: 2, memory: 4 Gi |
Example 🔗
In the following example, CPU is set to 500m, and memory is set to 1 Gi.
resources:
  limits:
    cpu: 500m
    memory: 1Gi
helm --namespace=<NAMESPACE> install my-splunk-otel-collector --set="splunkObservability.realm=<REALM>,splunkObservability.accessToken=<ACCESS_TOKEN>,clusterName=<CLUSTER_NAME>,agent.enabled=false,clusterReceiver.enabled=false,gateway.replicaCount=1,gateway.resources.limits.cpu=500m,gateway.resources.limits.memory=1Gi" splunk-otel-collector-chart/splunk-otel-collector
Resize your Network Explorer installation 🔗
Depending on the number of Kubernetes nodes you have, your resource needs might vary. You can make the following adjustments to your installation.
Change the resource footprint of the reducer 🔗
The reducer is a single pod per Kubernetes cluster. If your cluster contains a large number of pods, nodes, and services, you can increase the resources allocated to it.
The reducer processes telemetry in multiple stages, with each stage partitioned into one or more shards, where each shard is a separate thread. Increasing the number of shards in each stage expands the capacity of the reducer.
Change the following parameters in the OpenTelemetry Collector eBPF values file to increase or decrease the number of shards per reducer stage. You can set between 1-32 shards.
The default configuration is 1 shard per reducer stage.
reducer:
  ingestShards: 1
  matchingShards: 1
  aggregationShards: 1
The following example uses 4 shards per reducer stage:
reducer:
  ingestShards: 4
  matchingShards: 4
  aggregationShards: 4
To estimate the CPU and memory usage the reducer might require from a node, you can use these simple formulas:
Memory in Mebibytes (Mi) = 4 * Number of nodes in your cluster + 60
Fractional CPU in milliCPU (m) = Number of nodes in your cluster + 30
This gives you an approximate expected usage. Multiply the final numbers by a factor of 1.5 or 2 to give room for growth and spikes in usage.
Customize network telemetry generated by Network Explorer 🔗
If you want to collect fewer or more network telemetry metrics, you can update the OpenTelemetry Collector eBPF values file .
The following sections show you how to turn off or turn on different metrics.
Turn on all metrics, including metrics turned off by default 🔗
reducer:
  disableMetrics:
    - none
Turn off entire metric categories 🔗
reducer:
  disableMetrics:
    - tcp.all
    - udp.all
    - dns.all
    - http.all
Turn off an individual TCP metric 🔗
reducer:
  disableMetrics:
    - tcp.bytes
    - tcp.rtt.num_measurements
    - tcp.active
    - tcp.rtt.average
    - tcp.packets
    - tcp.retrans
    - tcp.syn_timeouts
    - tcp.new_sockets
    - tcp.resets
Turn off an individual UDP metric 🔗
reducer:
  disableMetrics:
    - udp.bytes
    - udp.packets
    - udp.active
    - udp.drops
Turn off an individual DNS metric 🔗
reducer:
  disableMetrics:
    - dns.client.duration.average
    - dns.server.duration.average
    - dns.active_sockets
    - dns.responses
    - dns.timeouts
Turn off an individual HTTP metric 🔗
reducer:
  disableMetrics:
    - http.client.duration.average
    - http.server.duration.average
    - http.active_sockets
    - http.status_code
Turn off an internal metric 🔗
reducer:
  disableMetrics:
    - ebpf_net.bpf_log
    - ebpf_net.otlp_grpc.bytes_sent
    - ebpf_net.otlp_grpc.failed_requests
    - ebpf_net.otlp_grpc.metrics_sent
    - ebpf_net.otlp_grpc.requests_sent
    - ebpf_net.otlp_grpc.successful_requests
    - ebpf_net.otlp_grpc.unknown_response_tags
Note
This list represents the set of internal metrics which are activated by default.
Turn on entire metric categories 🔗
reducer:
  enableMetrics:
    - tcp.all
    - udp.all
    - dns.all
    - http.all
    - ebpf_net.all
Turn on an individual TCP metric 🔗
reducer:
  enableMetrics:
    - tcp.bytes
    - tcp.rtt.num_measurements
    - tcp.active
    - tcp.rtt.average
    - tcp.packets
    - tcp.retrans
    - tcp.syn_timeouts
    - tcp.new_sockets
    - tcp.resets
Turn on an individual UDP metric 🔗
reducer:
  enableMetrics:
    - udp.bytes
    - udp.packets
    - udp.active
    - udp.drops
Turn on an individual DNS metric 🔗
reducer:
  enableMetrics:
    - dns.client.duration.average
    - dns.server.duration.average
    - dns.active_sockets
    - dns.responses
    - dns.timeouts
Turn on an individual HTTP metric 🔗
reducer:
  enableMetrics:
    - http.client.duration.average
    - http.server.duration.average
    - http.active_sockets
    - http.status_code
Turn on an internal metric 🔗
reducer:
  enableMetrics:
    - ebpf_net.span_utilization_fraction
    - ebpf_net.pipeline_metric_bytes_discarded
    - ebpf_net.codetiming_min_ns
    - ebpf_net.entrypoint_info
    - ebpf_net.otlp_grpc.requests_sent
Note
This list does not include the entire set of internal metrics.
Example 🔗
In the following example, all HTTP metrics along with certain individual TCP and UDP metrics are deactivated. All DNS metrics are collected.
reducer:
  disableMetrics:
    - http.all
    - tcp.syn_timeouts
    - tcp.new_sockets
    - tcp.resets
    - udp.bytes
    - udp.packets
In the following example, all HTTP metrics along with certain individual internal metrics are turned on.
Note
The disableMetrics flag is evaluated before the enableMetrics flag.
reducer:
  enableMetrics:
    - http.all
    - ebpf_net.codetiming_min_ns
    - ebpf_net.entrypoint_info
Migrate from networkExplorer to eBPF Helm chart 🔗
Starting from version 0.88 of the Helm chart, the networkExplorer setting of the Splunk OpenTelemetry Collector Helm chart is deprecated. networkExplorer settings are fully compatible with the OpenTelemetry Collector eBPF Helm chart, which is supported by Network Explorer.
To migrate to the OpenTelemetry Collector eBPF Helm chart, follow these steps:
Make sure that the Splunk OpenTelemetry Collector Helm chart is installed in data forwarding (Gateway) mode:
gateway:
  enabled: true
Disable the
networkExplorersetting in the Splunk OpenTelemetry Collector Helm chart:networkExplorer: enabled: false
Retrieve the name of the Splunk OpenTelemetry Collector gateway service:
kubectl get svc | grep splunk-otel-collector-gateway
Install the upstream OpenTelemetry Collector eBPF Helm chart pointing to the Splunk OpenTelemetry Collector gateway service:
helm repo add open-telemetry https://open-telemetry.github.io/opentelemetry-helm-charts
helm repo update open-telemetry
helm install my-opentelemetry-ebpf -f ./otel-ebpf-values.yaml open-telemetry/opentelemetry-ebpf
The otel-ebpf-values.yaml file must have the endpoint.address option set to the Splunk OpenTelemetry Collector gateway service name captured in the third step.
endpoint:
  address: <my-splunk-otel-collector-gateway>
Additionally, if you had any custom settings in the networkExplorer section, you need to move them to the otel-ebpf-values.yaml file. See the OpenTelemetry Collector eBPF values file for more information.
Next steps 🔗
After you’ve set up Network Explorer, you can start monitoring network telemetry metrics coming into your Splunk Infrastructure Monitoring platform using 1 or more of the following options:
Built-in Network Explorer navigators. To see the Network Explorer navigators, follow these steps:
From the Splunk Observability Cloud home page, select Infrastructure on the left navigator.
Select Network Explorer.
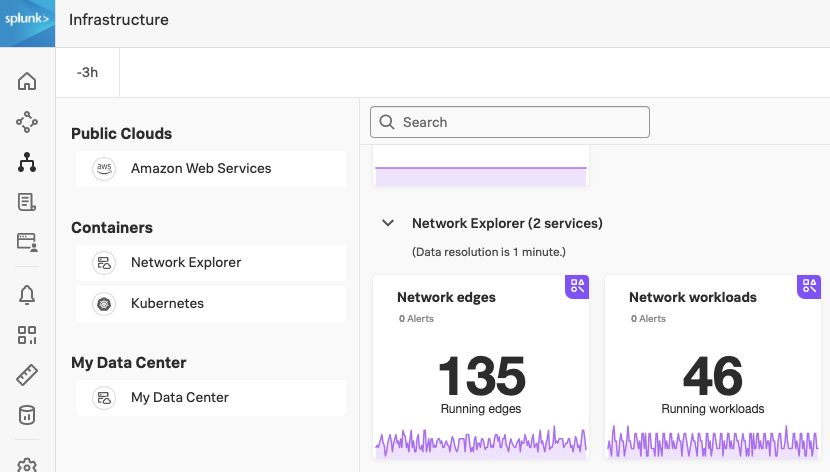
Select the card for the Network Explorer navigator you want to view.
For more information, see Use navigators in Splunk Infrastructure Monitoring.
Service map. For more information, see Monitoring service dependencies with network map.
Alerts and detectors. For more information, see Introduction to alerts and detectors in Splunk Observability Cloud.
For more information on metrics available to collect with Network Explorer, see Network telemetry metrics.