Timeline 🔗
The Timeline acts as the homepage of your Splunk On-Call instance. The layout of the Timeline is designed to help you surface pertinent incident information quickly, improve usability and decrease overall time to resolution.
Incidents and Incident Tabs 🔗
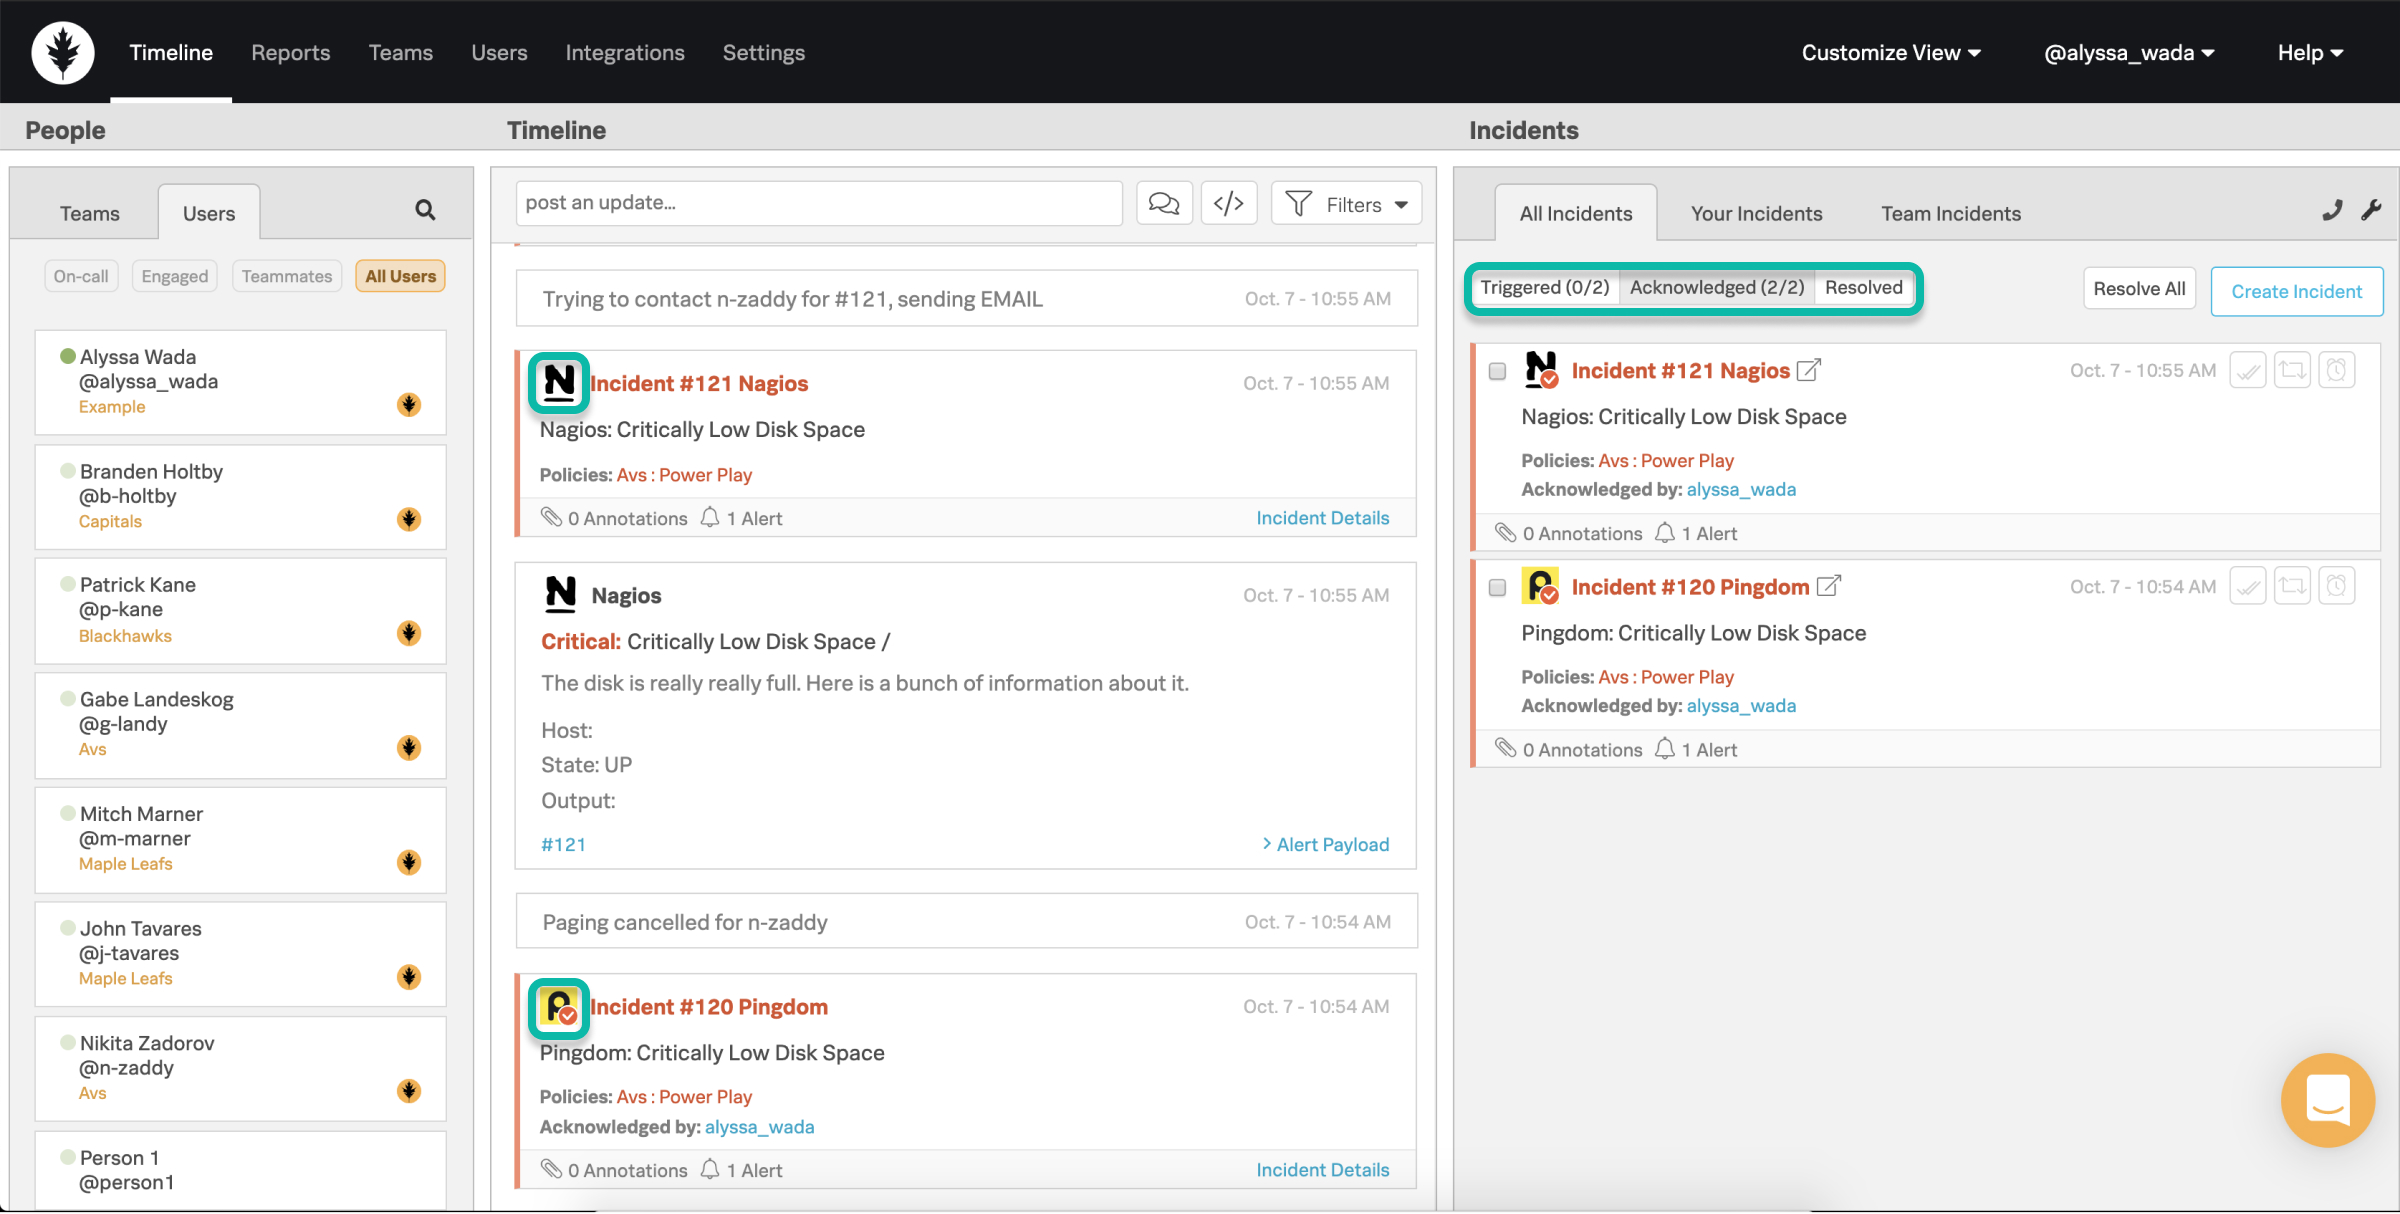
All alerts and activity can be found in the Timeline. For a more organized view, the Incident Pane allows you to view incidents based on who they belong to and their current state: triggered, acknowledge, or resolved.
All incident and alert messages derived from integrated monitoring tools in the Timeline and the Incident Pane includes their respective logos to help you rapidly identify the source of an alert. Manually created incidents, along with alerts and incidents originating from the Email Endpoint or the REST API integrations, will remain logo free.
Incident Cards 🔗
Access Incident Details directly from the Timeline by selecting incident details. This will expand the incident and its event history in the Incident Pane. Quickly identify responsible parties during a firefight by easily seeing which policies are being paged. Here you can also find annotation and alert counts to the bottom left-hand corner of the Incident Card. Selecting the Annotations count opens the Annotations tab in the Incident Details in the Incident Pane.

Filters and Customized view 🔗
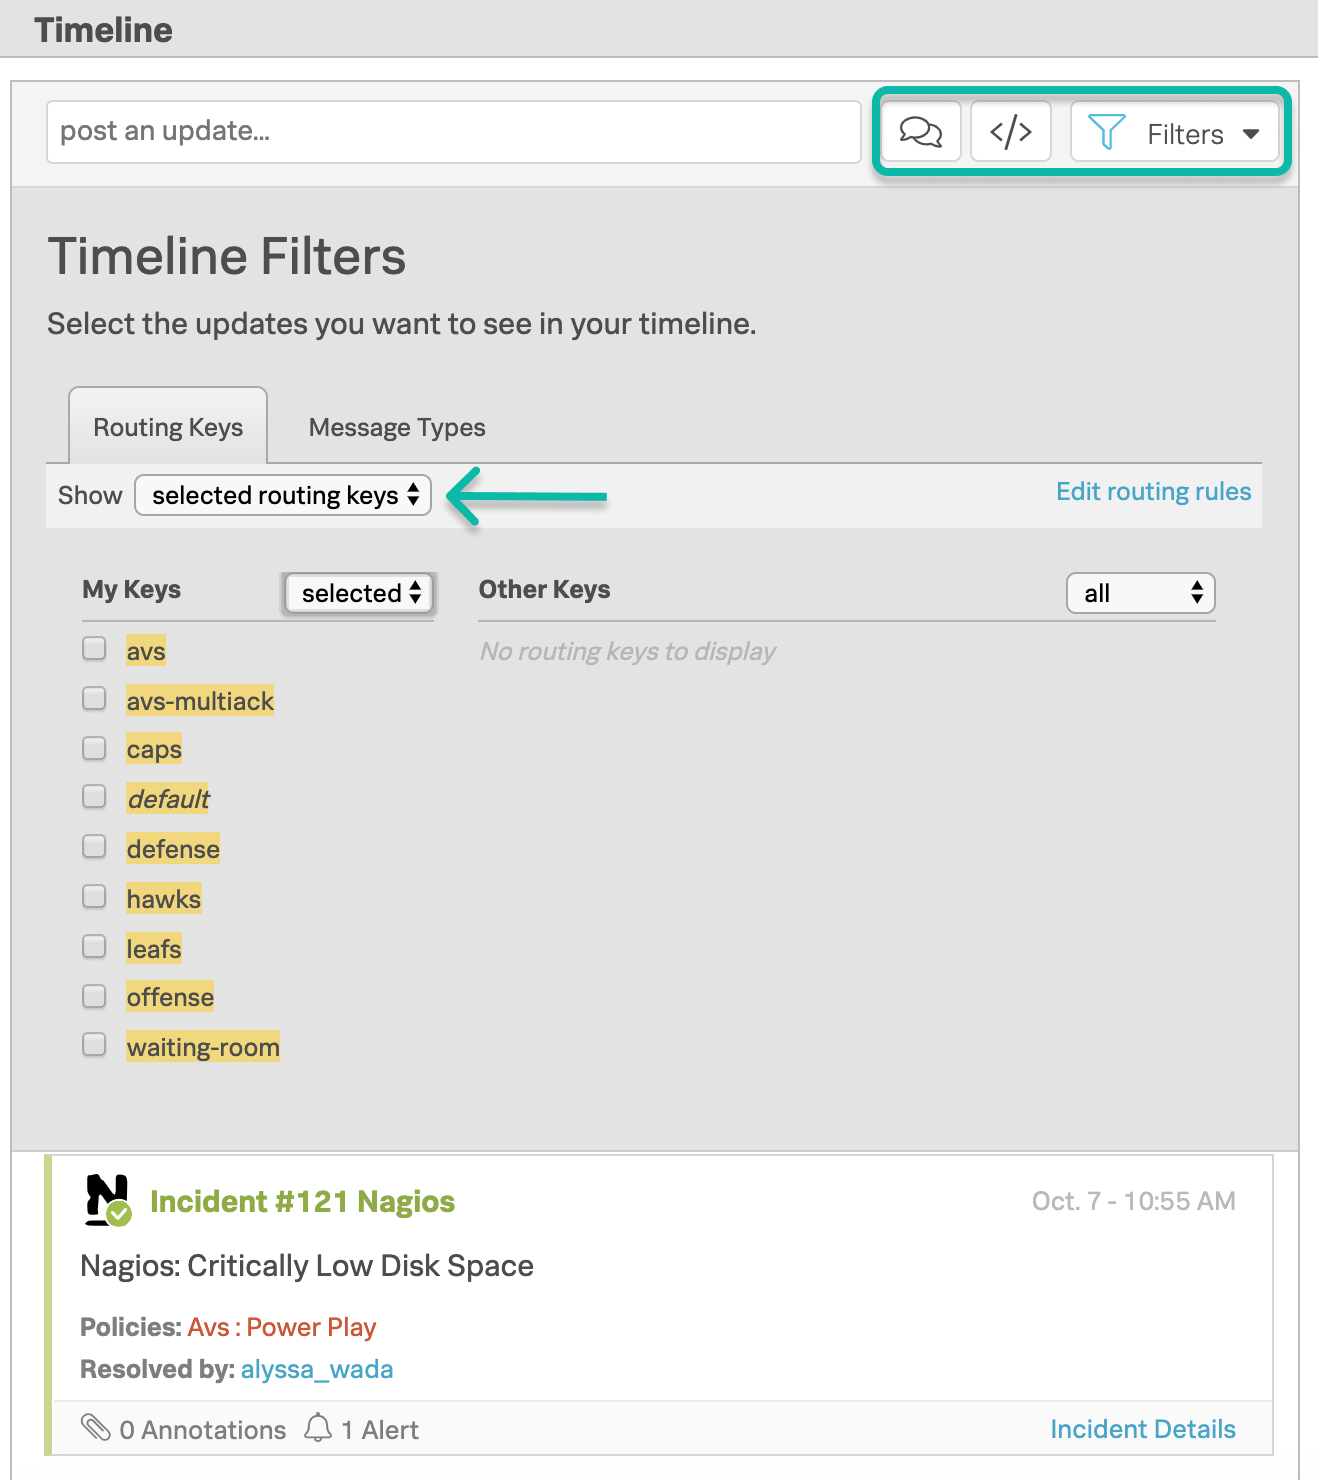
There are multiple ways to filter the Timeline to only show events and messages of interest to you. Here’s how to filter:
All Filters: Selecting this option displays a drop-down with options to filter the Timeline by Route Key or Message Type. Splunk On-Call will remember which options you select so your choices persist between sessions.
Delivery Insights Quick Filter: Selecting this filter, which works like an on-off button, will filter the Timeline for only Delivery Insights Message Types. All other message types will be hidden.
Chat Quick Filter: Selecting this filter, which works like an on-off button, will filter the Timeline for only chat messages. This is useful when you’re trying to follow a conversation in the Timeline. It removes all other events so chats are streamlined.
It’s important to note the Delivery Insights and Chat Quick Filters can’t be used simultaneously. If one filter is on, selecting the other filter turns the first off. The filter icon will turn blue when it’s active. Filter selections under All Filters will be disregarded when a Quick Filter is on.
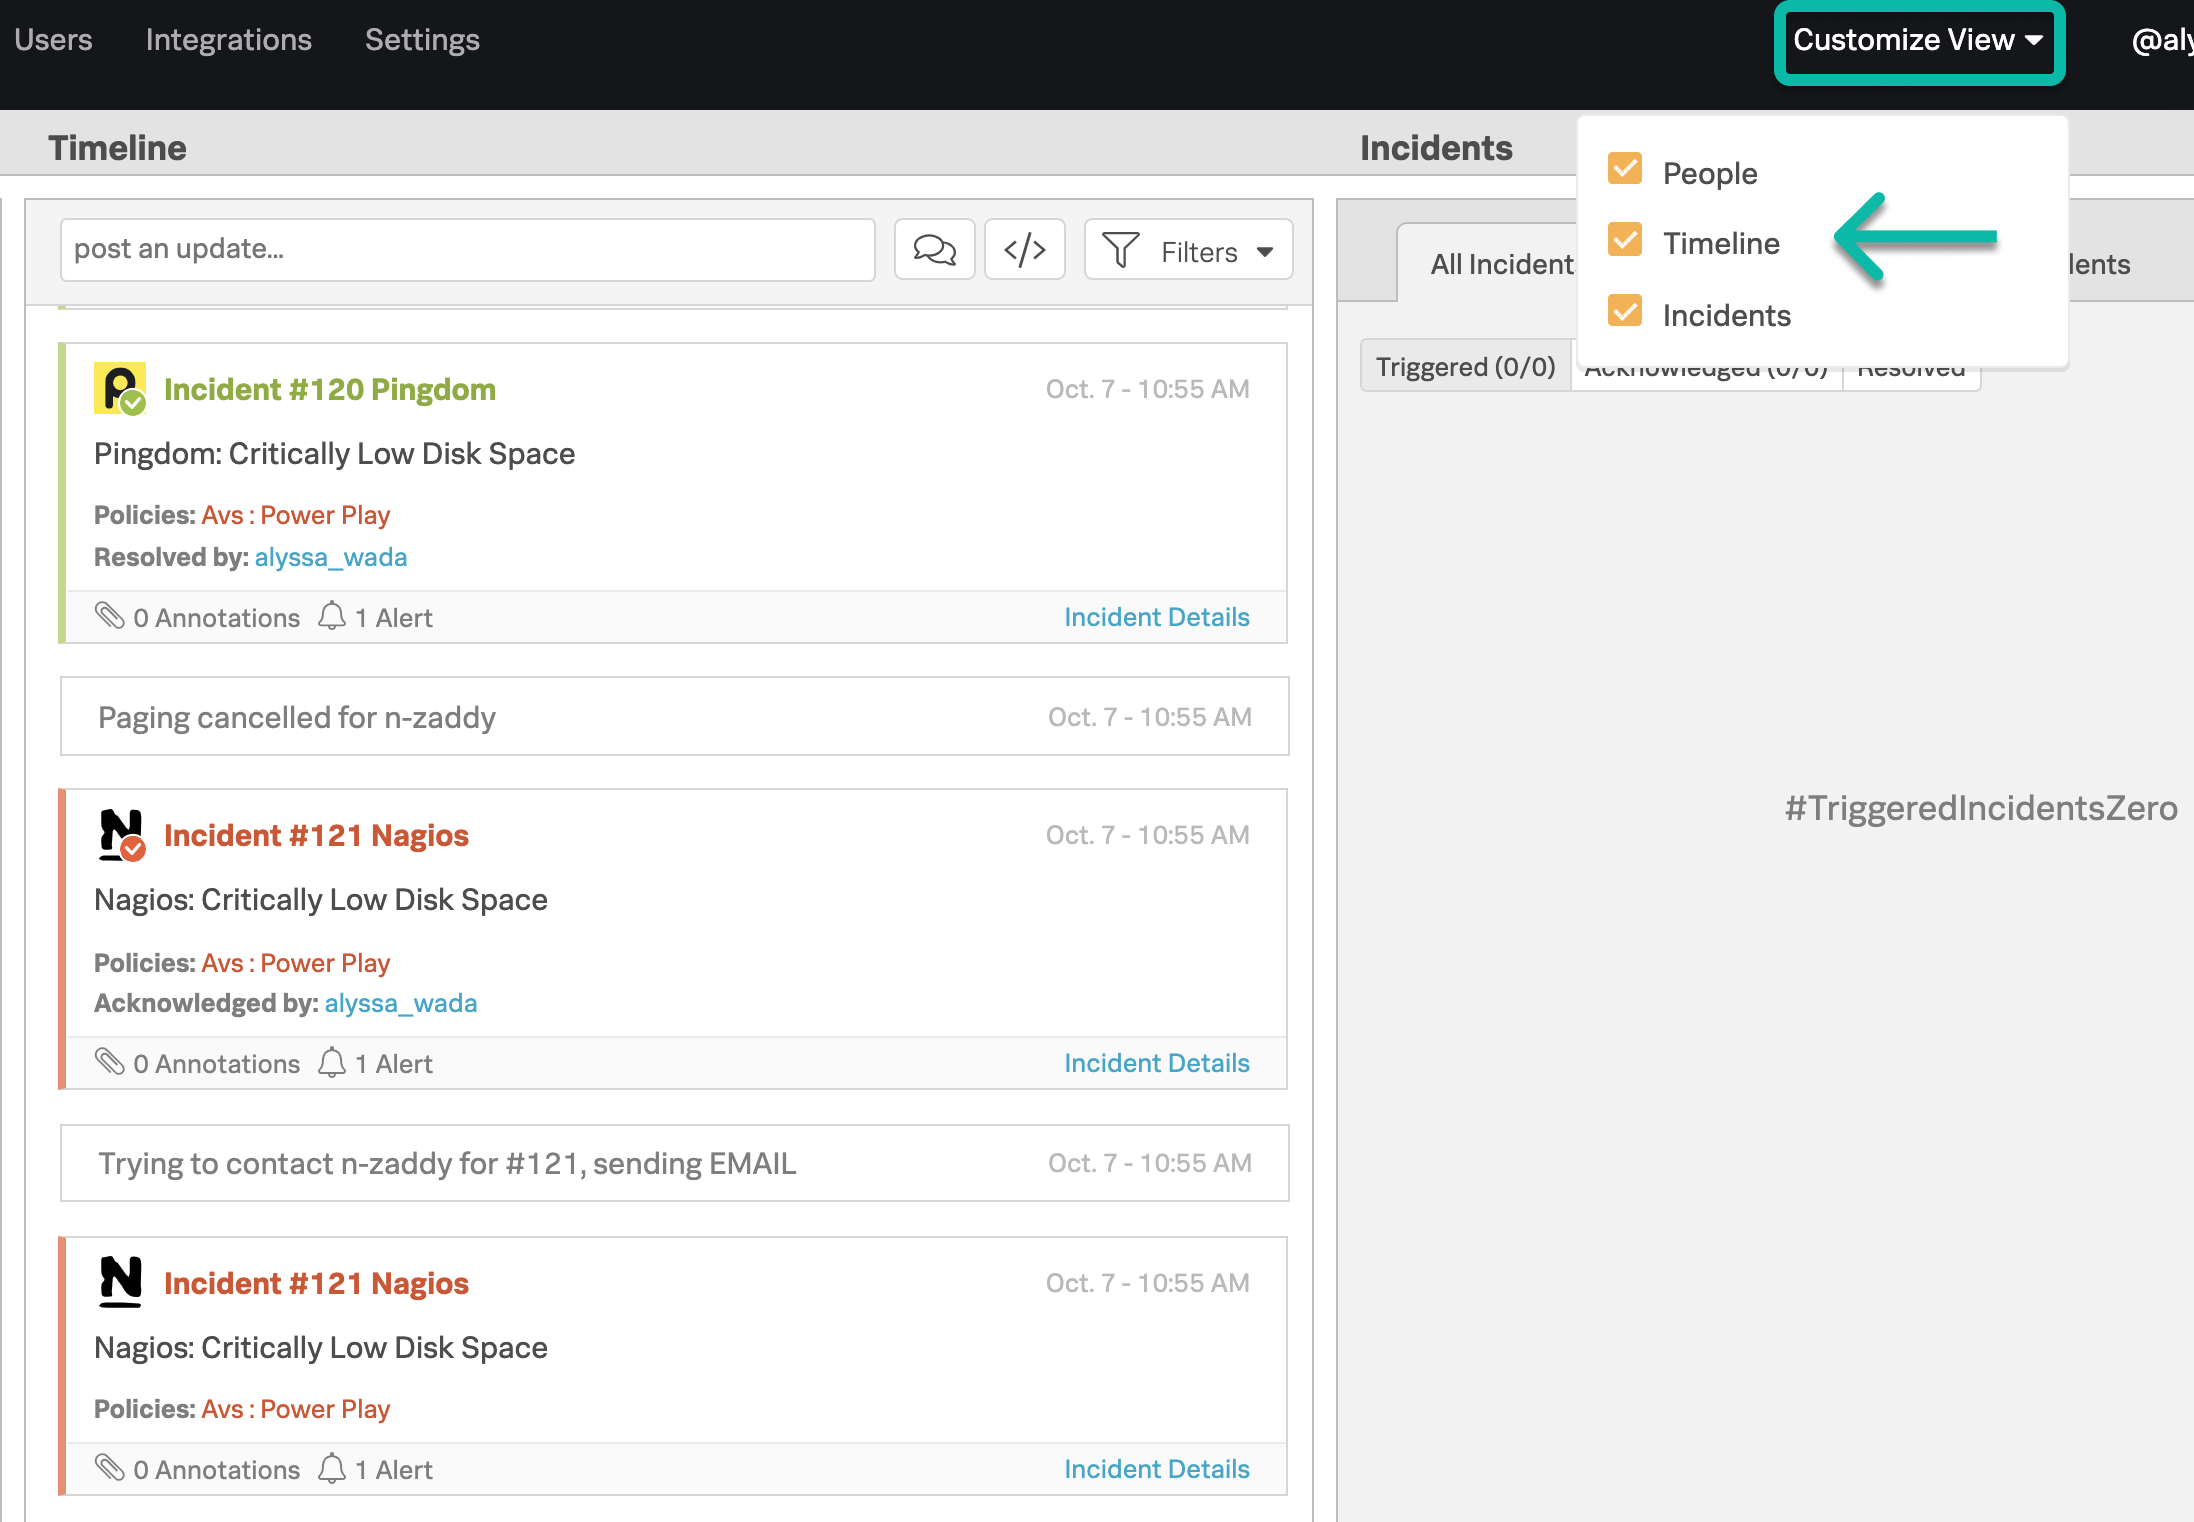
If you would prefer to have a less noisy view of your Splunk On-Call homepage, you have the ability to customize your view to include or exclude what is most important to you. For example, if you would prefer to only see the Timeline and Incident Pane, you can deselect the People pane.