Scenario: Sasha analyzes memory usage using AlwaysOn Profiling 🔗
Sasha, the lead developer at Buttercup Games, is working on a new release of Birdlympics. Thanks to AlwaysOn Profiling, Sasha already managed to optimize the code and eliminate CPU consumption issues. See Scenario: Sasha finds performance issues using AlwaysOn Profiling.
Before launching a new version of the game, Sasha decides to also analyze memory usage, which has proven problematic after they introduced new levels. The site reliability engineers on the team have complained about odd increases in memory consumption across the infrastructure.
To improve the situation while working on several optimizations, Sasha decides to understand where Birdlympics is allocating memory, and opens the Java Runtime Metrics dashboard.
Check for unusual patterns in memory metrics 🔗
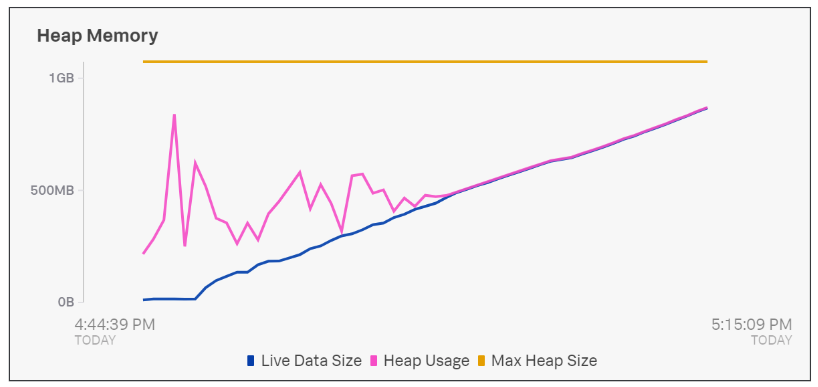
After getting some memory consumption alerts, Sasha opens the Java Runtime Metrics dashboard. The charts confirm the sudden increase in memory usage, with available memory depleting:
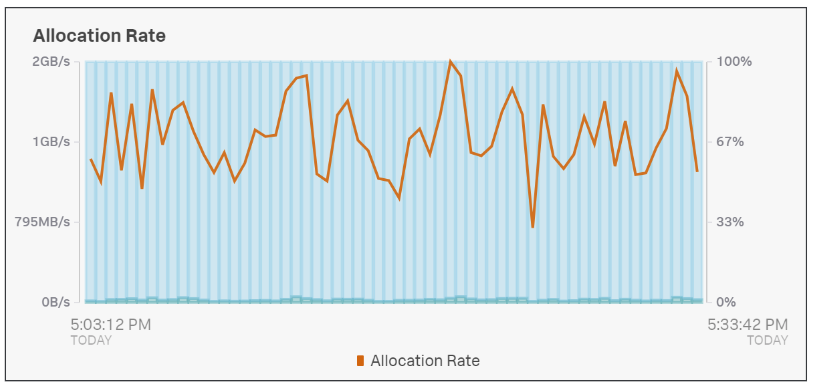
The allocation rate is also high:
Browse the flame graph to identify inefficient processes 🔗
To find the root cause of the increased memory consumption, Sasha opens AlwaysOn Profiling, selects Memory, and applies the following filters:
A custom time that matches the time the build was running in the demo environment
The
demoenvironment and thebirdlympicsservice, as well as the specific host
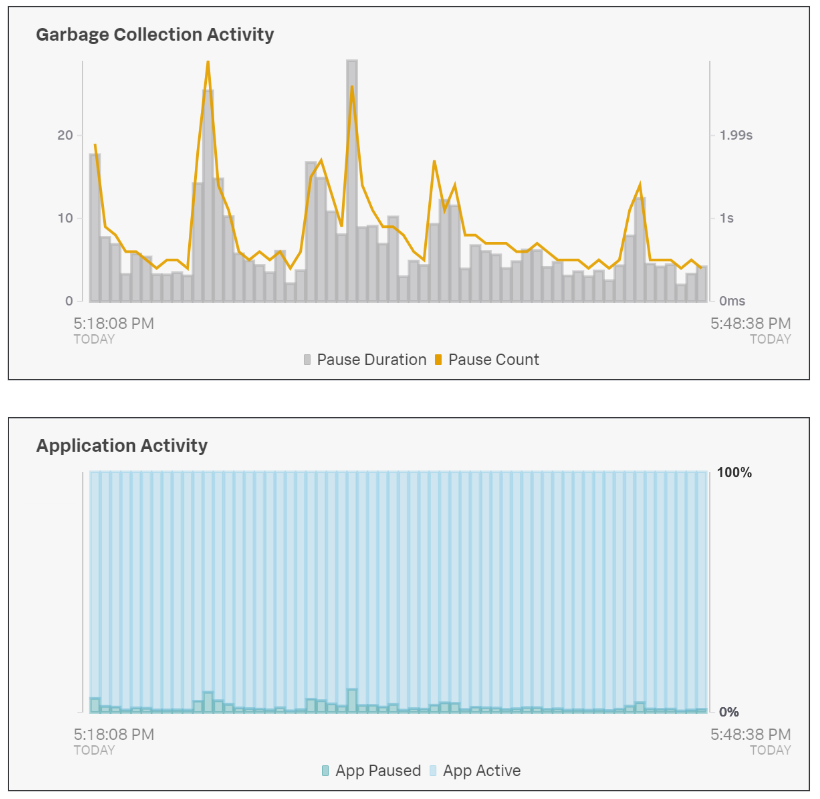
The charts before the memory flame graph confirm that while the game had been active, it had to pause up to 10% of the time due to garbage collection, causing the game to freeze:
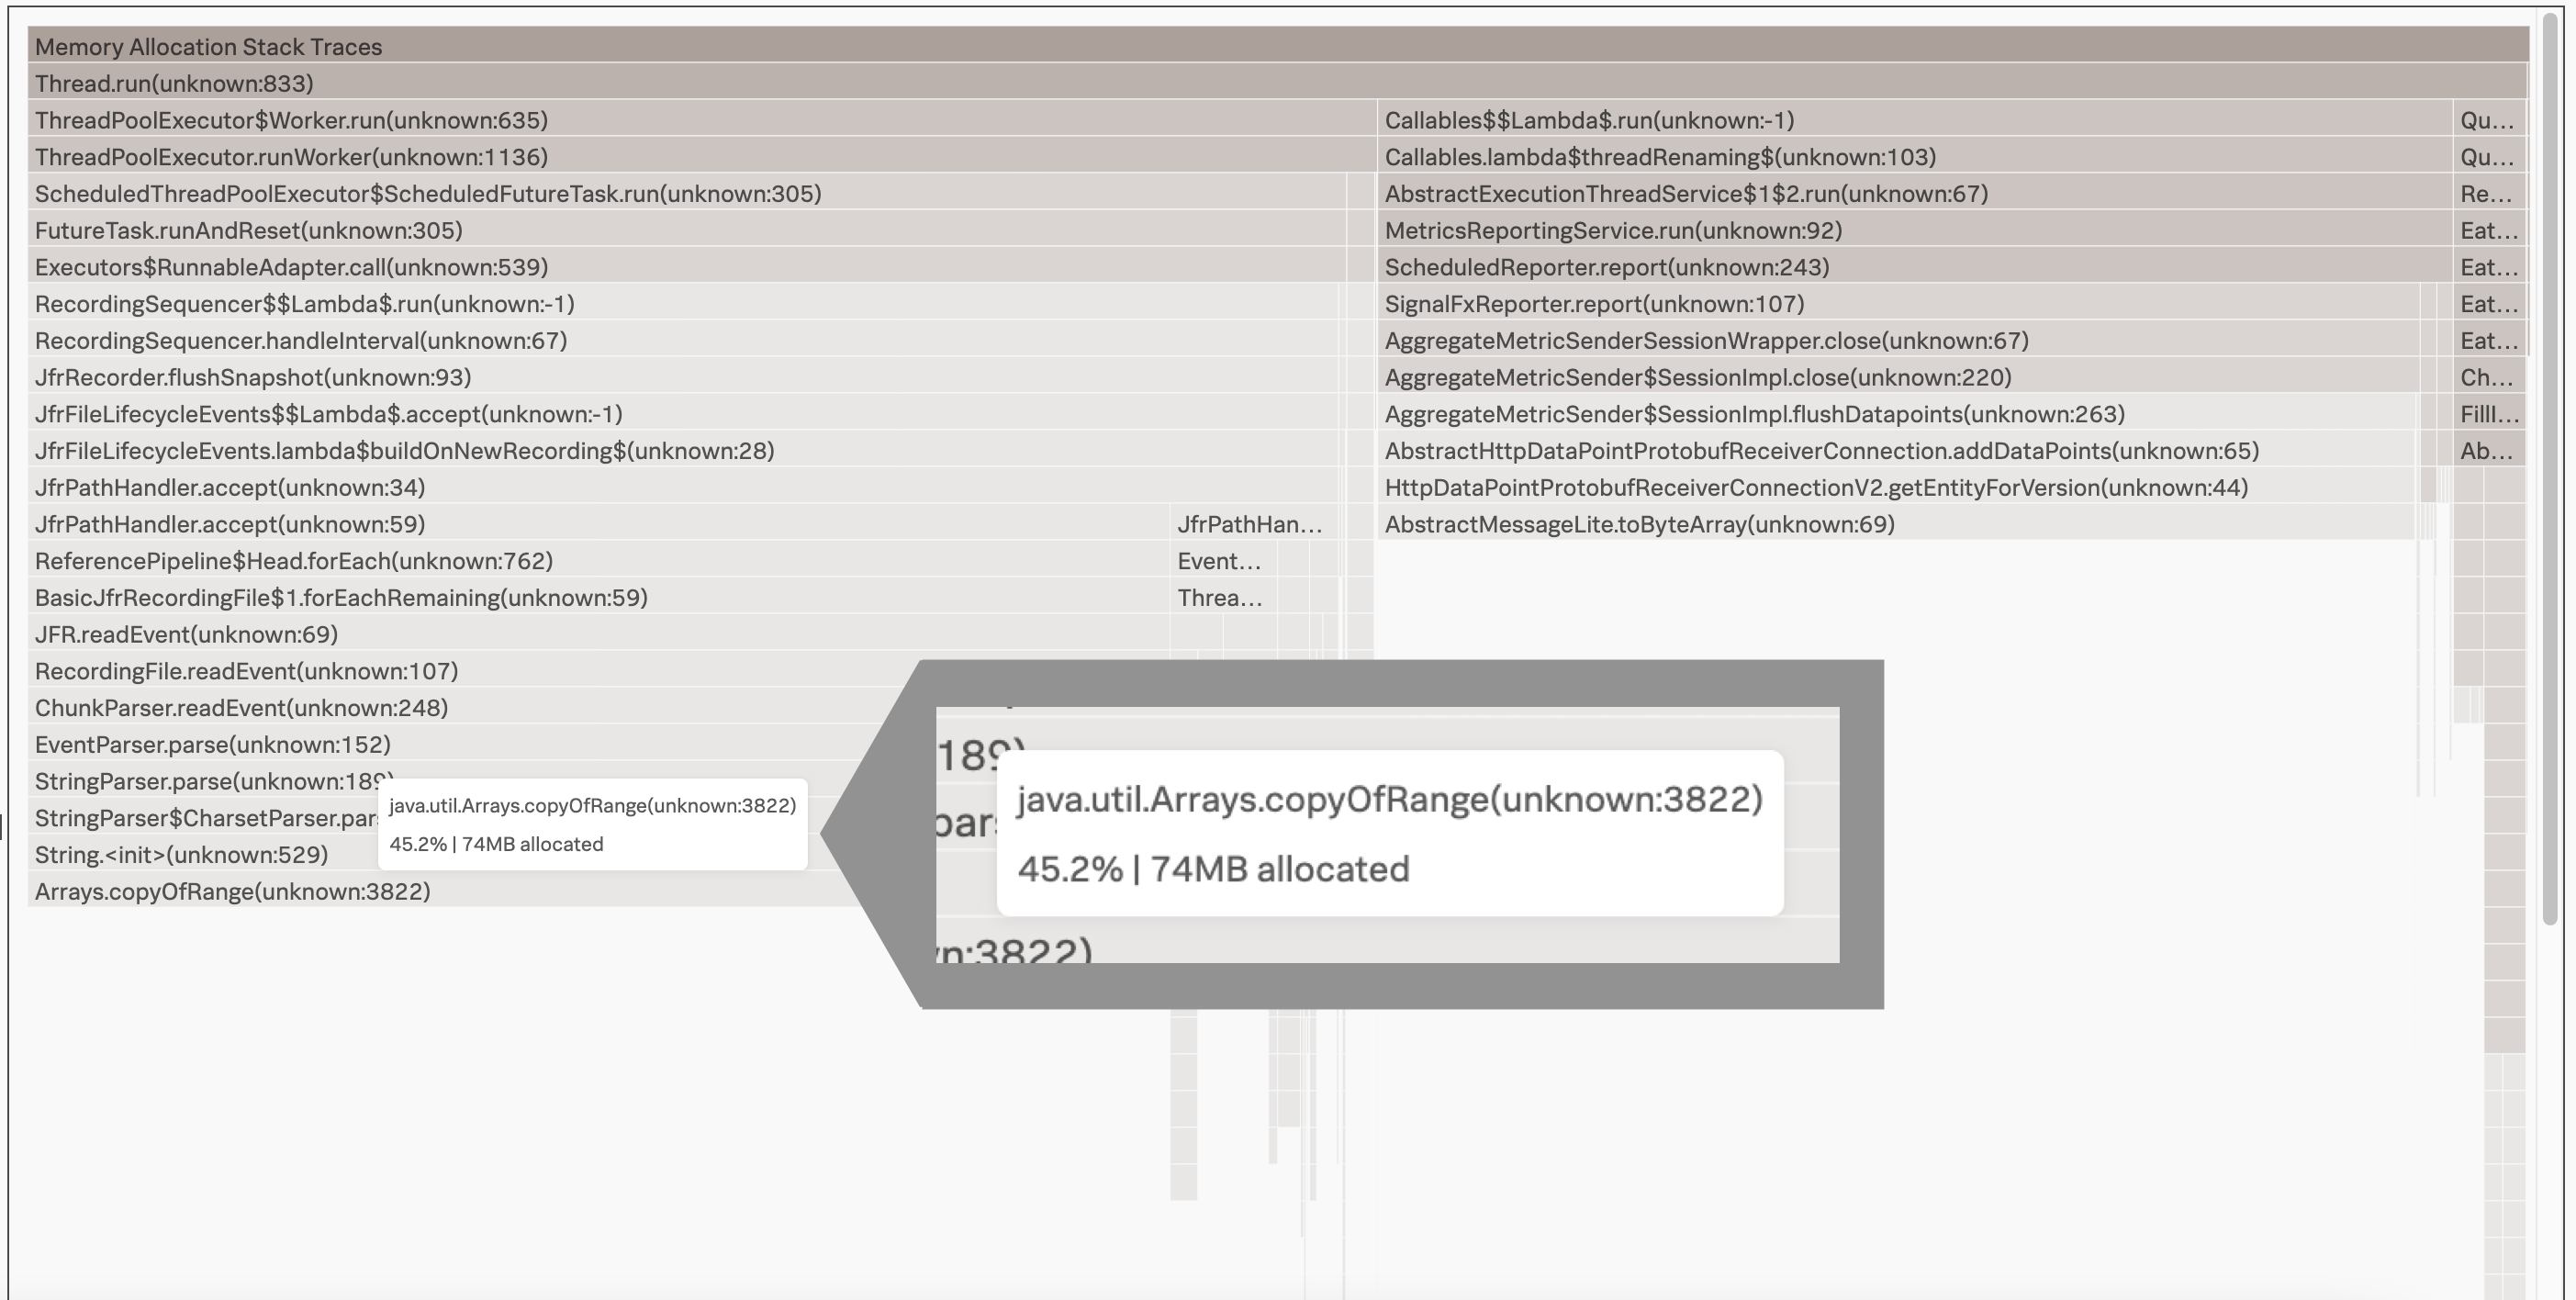
Sasha selects a specific time period using the chart and examines the flame graph. The flame graph shows memory allocation as it happened during the selected time period. Each frame of the flame graph shows the amount of memory allocated for each method during the same time.
Summary 🔗
By using a combination of Splunk Observability Cloud dashboards, Splunk APM, and AlwaysOn Profiling, Sasha identified critical memory issues in the game, as well as code that was allocating too much memory.
With this information, Sasha patches the game. Checking the memory metrics again, Sasha notices that the charts are back to normal, and that garbage collection is effective again.
Learn more 🔗
For more information on AlwaysOn Profiling and how to start using it, see Introduction to AlwaysOn Profiling for Splunk APM.
For more information on the profiling flame graph, see Understand and use the flame graph.
For more Splunk APM scenarios, see Scenarios for troubleshooting errors and monitoring application performance using Splunk APM.
For more information on dashboards, see Create and customize dashboards.