Scenario: Sasha finds performance issues using AlwaysOn Profiling 🔗
Birdlympics is a Java game launched by Buttercup Games. At the beginning of each round, a player selects three racers. After each race, Birdlympics stores the results in a PostgreSQL database, which feeds the statistics for each bird. The following animation shows the Birdlympics game in action:

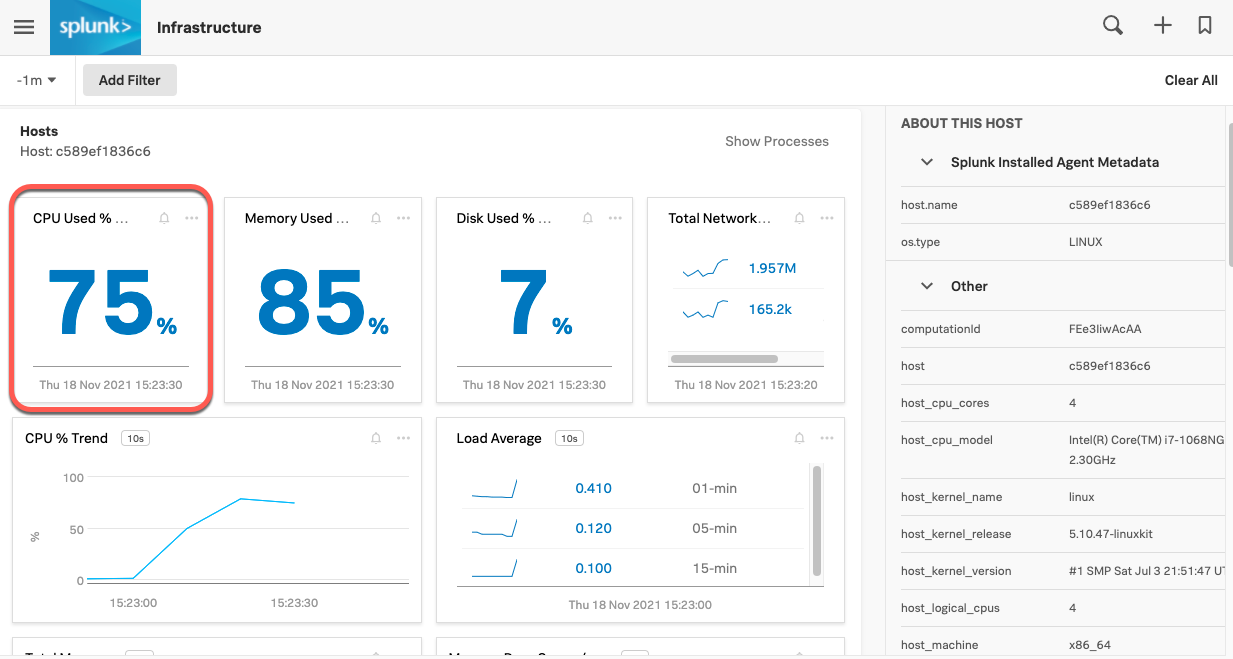
The day the Buttercup Games marketing team starts a campaign to promote Birdlympics, Sasha, the lead developer, gets a high CPU consumption alert for the machine hosting the game. He opens the host details in Splunk Infrastructure Monitoring and notices unusually high CPU consumption:
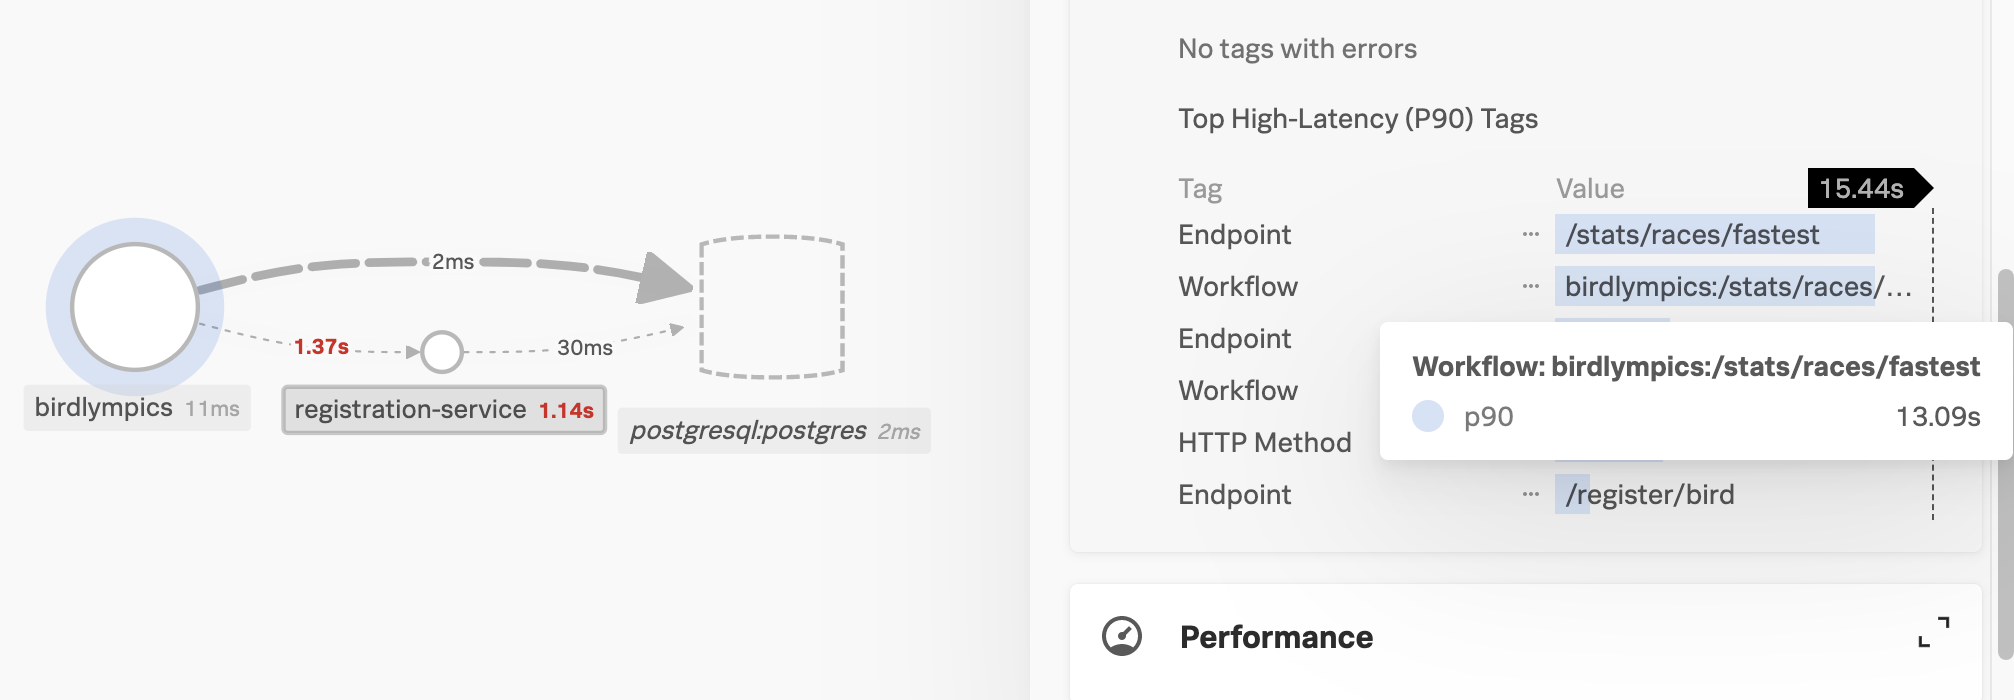
Sasha notices that the JVM process takes up a big part of CPU load: the cause of the performance issue might lie in the code of Birdlympics. He explores the Birdlympics service map in Splunk APM and notices high latency for the controller in charge of calculating what bird is the fastest, which causes delays in the user experience:
Because Sasha has instrumented the game using the Splunk Java agent with AlwaysOn Profiling enabled, he uses Splunk APM to troubleshoot the issue and fix the bottleneck. He takes the following steps:
Explore slow spans and their stack traces 🔗
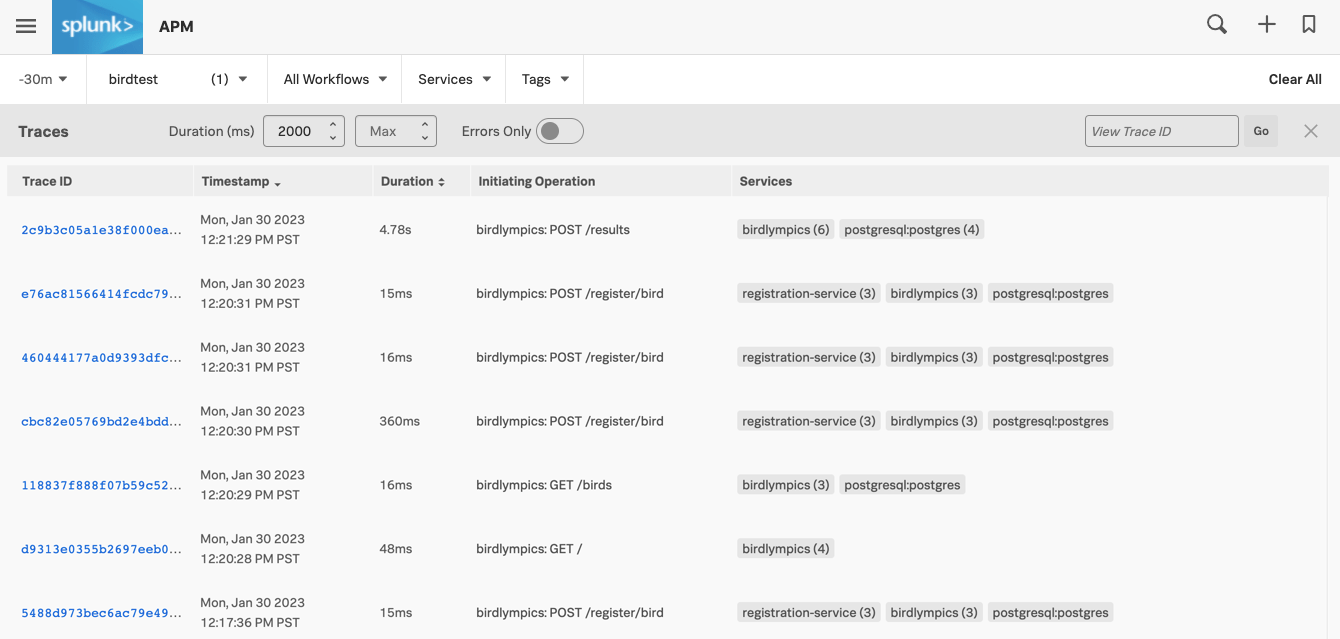
Eager to understand what might be causing the high load, Sasha opens Splunk APM, selects the Birdlympics environment, and selects Traces. He filters the available traces so that the minimum duration is one second. Almost all results include the stats/races/fastest operation:
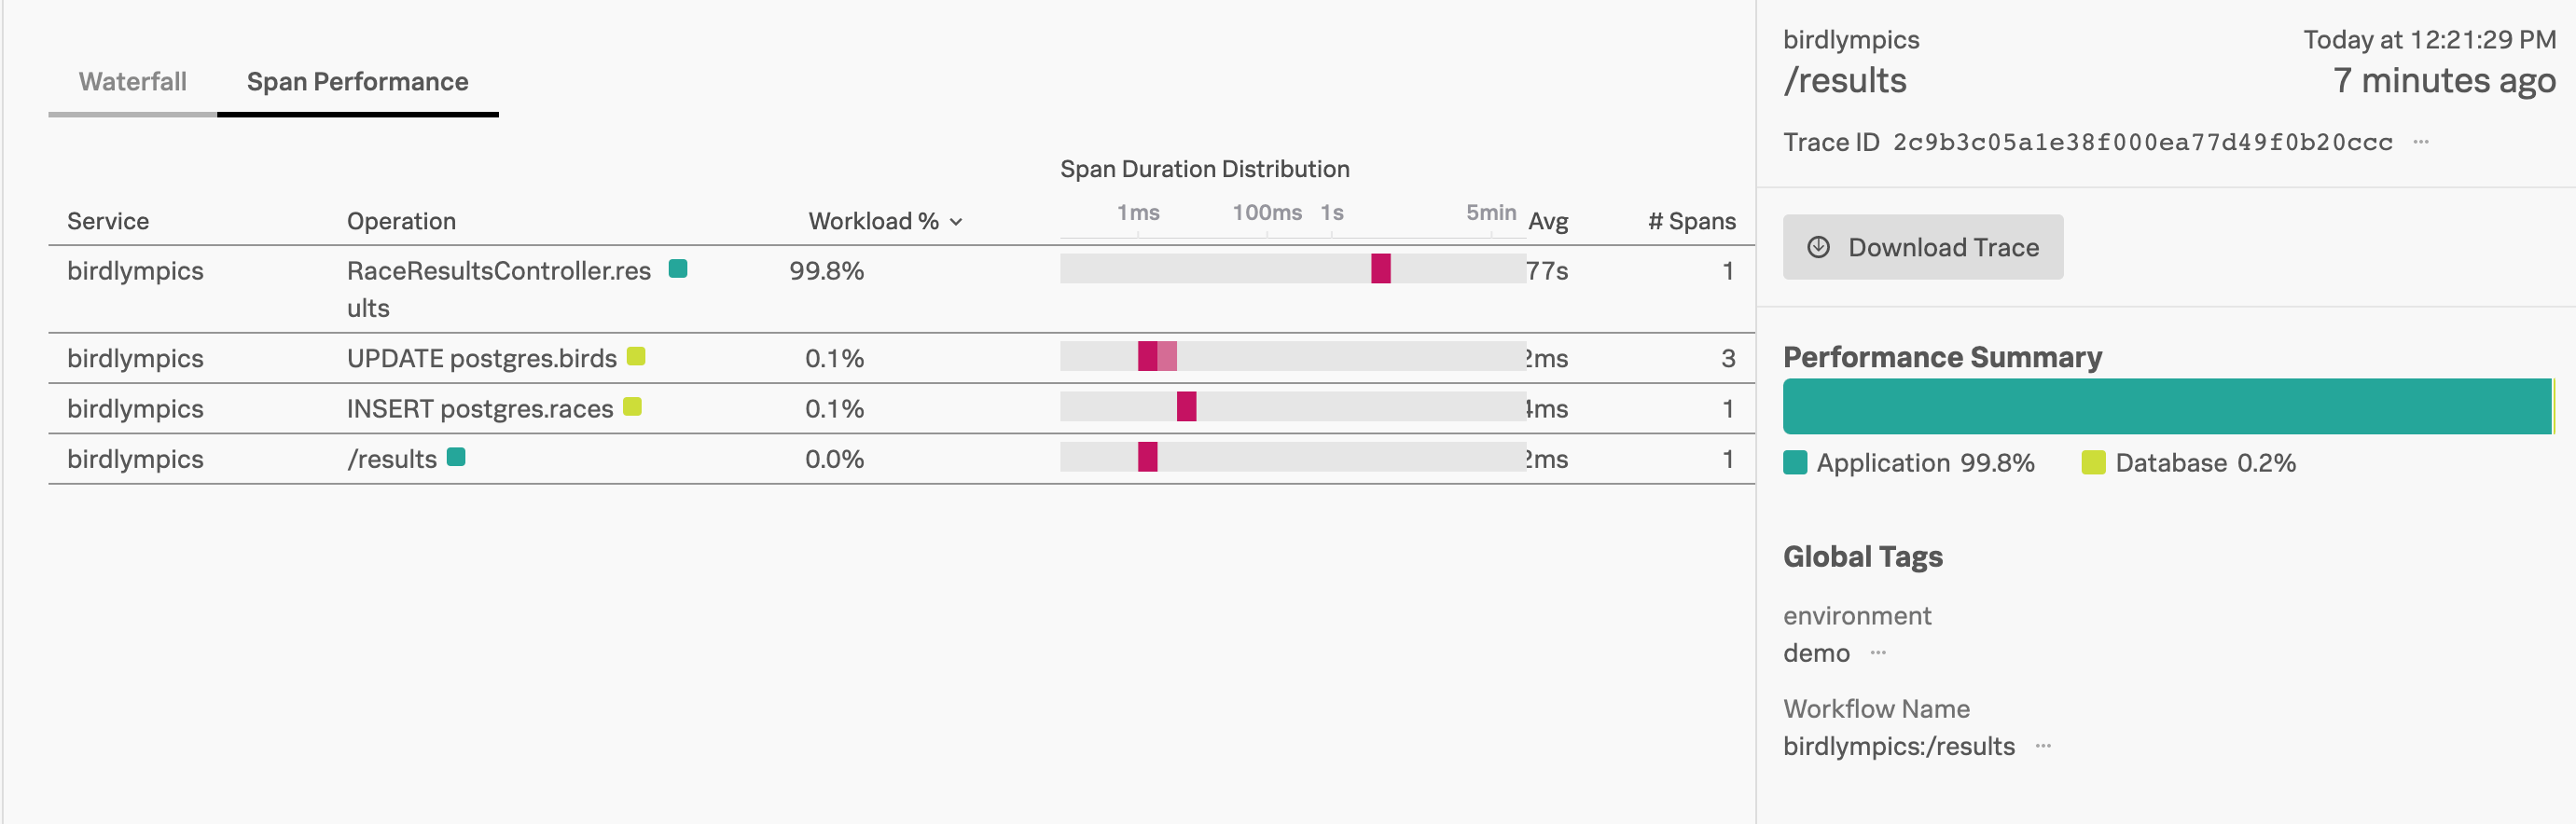
Sasha opens the slowest trace to examine the spans. Many spans have call stacks available, which show which functions Birdlympics called and in which order at that point in time. Sasha expands one of the spans and scrolls the stack trace to identify the code behind the bottleneck:
Sasha identifies some classes that connect to the database. The Span Performance view confirms that the StatsController.fastestRace function is responsible for 84% of the workload. The fastestRace function calculates which contestant has been faster at the end of the race, and performs database calls:
Browse the aggregated data using the flame graph 🔗
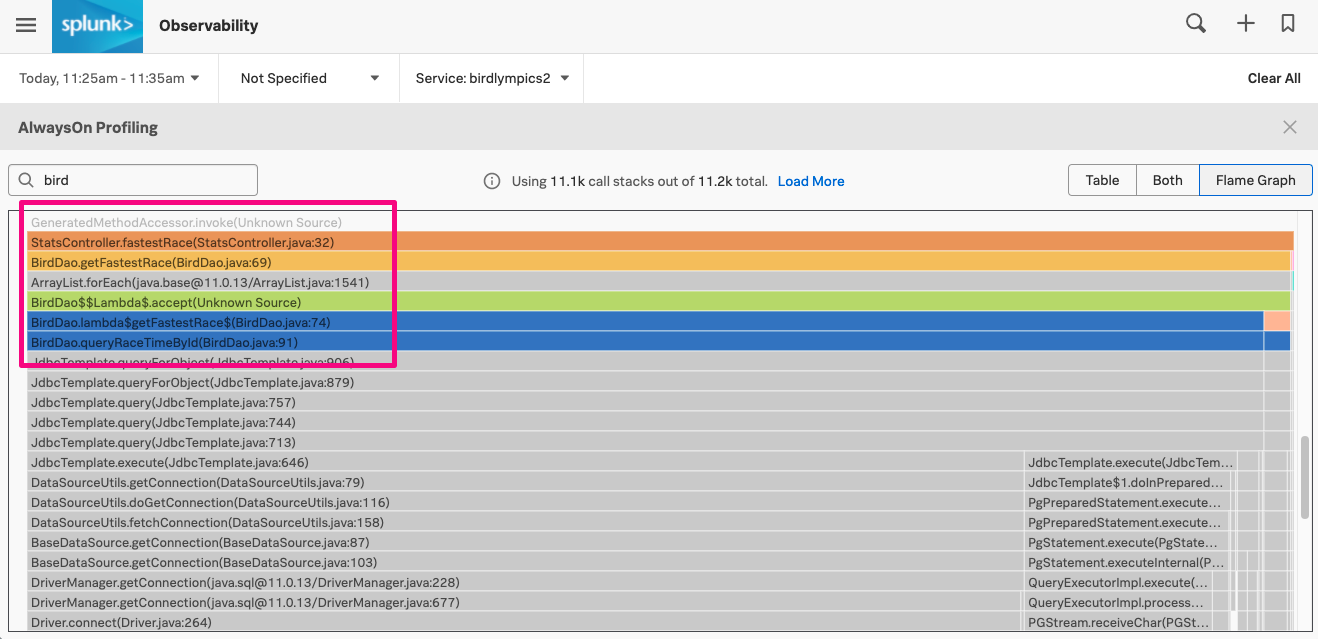
The stack trace puts Sasha on the right track, but more evidence would help to confirm what needs to be optimized. From the span view, he selects View in AlwaysOn Profiler. Sasha filters the view so that the flame graph highlights only the application code, and he proceeds to scroll down to analyze the stacks:
The bulk of the application code impacting performance comes from line 69 in the BirdDao.java file. The self time for the stack frame, which summarizes the time spent by the function, is higher than expected:
Check the code for bugs and bottlenecks 🔗
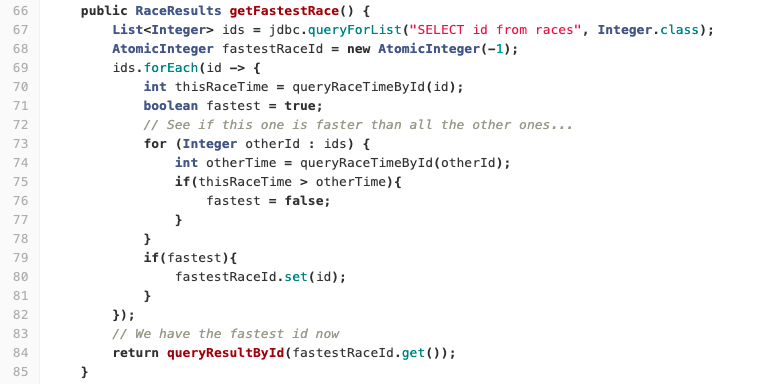
Using the information gathered from Splunk APM and its flame graph, Sasha opens the code editor to check BirdDao.java. The problem turns out to be rather trivial. An inefficient loop at line 69 is causing an increase in database queries, which in turn drives CPU consumption under heavy load:
Fix the code and measure performance again 🔗
After improving the code and restarting the application, the impact on performance is largely gone, and the flame graph shows much narrower stack frames for the functions that were causing bottlenecks. Sasha passes the good news to the marketing team and reassures them that the marketing campaign can go ahead.
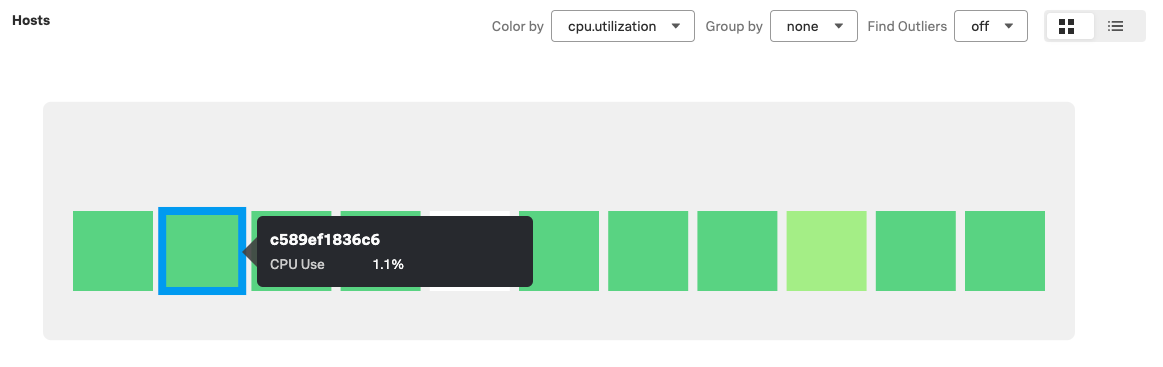
The following image shows the hosts navigator of Splunk Infrastructure Monitoring. The highlighted square is the virtual machine hosting the game server:
Summary 🔗
By using a combination of Splunk Infrastructure Monitoring, Splunk APM, and AlwaysOn Profiling, Sasha managed to quickly identify and fix two major performance issues in the Birdlympics game, allowing the marketing campaign to continue while avoiding the need to scale up resources.
See how Sasha uses AlwaysOn Profiling to identify memory issues in Scenario: Sasha analyzes memory usage using AlwaysOn Profiling.
Learn more 🔗
For more information on AlwaysOn Profiling and how to start using it, see Introduction to AlwaysOn Profiling for Splunk APM.
For more information on the profiling flame graph, see Understand and use the flame graph.
For more Splunk APM scenarios, see Scenarios for troubleshooting errors and monitoring application performance using Splunk APM.
For more information on monitoring hosts, see Monitor hosts.