Scenario: Skyler identifies sources of high network transfer costs 🔗
The following scenario features examples from Buttercup Games, a fictitious e-commerce company.
Skyler, a senior site reliability engineer (SRE) at Buttercup Games, gets a charge from the VP of Engineering to reduce the company’s infrastructure costs. Over the past 3 months, infrastructure costs have been growing as a percentage of revenue.
Skyler reviews a report from the cloud provider and notices substantial increases in network transfer costs over the same period. They realize that reducing network transfer costs helps move the needle on the company’s cost reduction effort.
As an experienced SRE, Skyler knows cloud providers charge for cross zone, cross region, and egress traffic. However, due to the Kubernetes environment Buttercup Games runs, Skyler isn’t sure which services are responsible for this increase in network traffic.
They open Network Explorer and look at the Network workloads navigator.
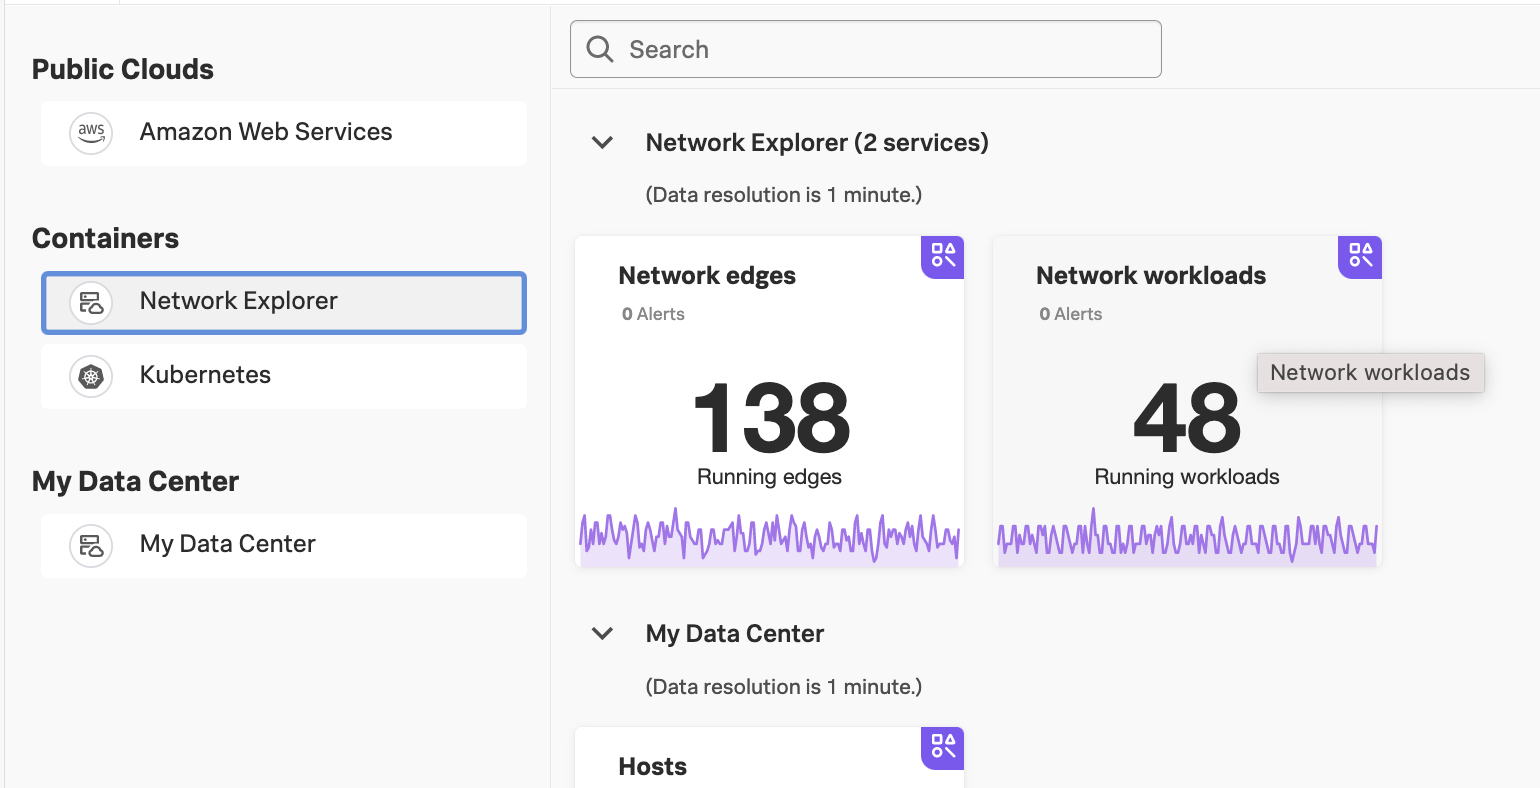
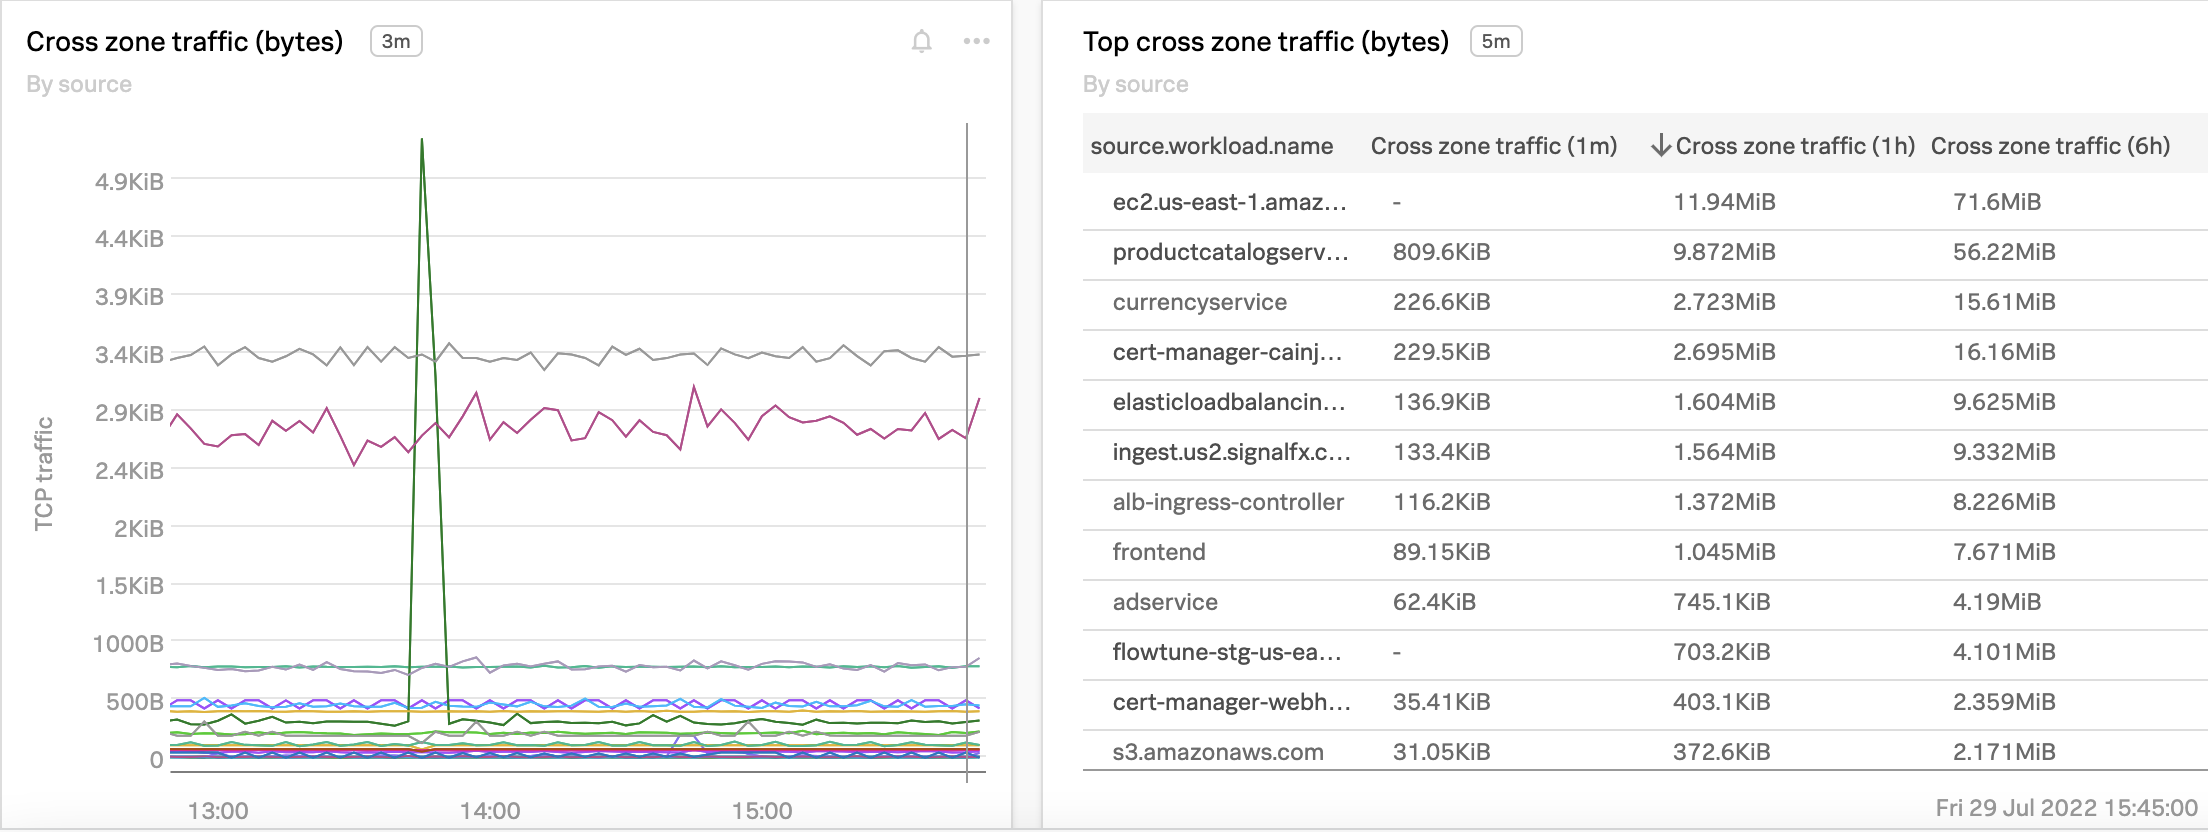
In the Cross zone traffic chart and the Top cross zone traffic table, Skyler can identify exactly which source and destination services are generating the most cross-zone traffic.
Now that Skyler has isolated the sources of high network transfer costs, they can start making adjustments to their cluster to localize traffic within zones, without reducing replicas or losing redundancy.