Add context to metrics using events 🔗
An event, or event time series (ETS), is a specific occurrence that can be represented in Splunk Observability Cloud outside of the flow of streaming metrics. Events provide context to metric data.
Events are very basic, and you can’t apply analytic functions to events. However, you can plot them based on their metadata.
Events in Splunk Observability Cloud 🔗
In Splunk Observability Cloud, events are created in different situations:
Events are created whenever a detector triggers an alert. A second event is created when the alert clears, is manually resolved, or is stopped due to the detector being edited or deleted.
The SessionLog events capture 2 actions: “session created” or “session deleted”. A SessionLog event is created when a user explicitly logs into or out of your organization. Users who navigate to Splunk Observability Cloud who already have an active session aren’t prompted to log in and, therefore, don’t create a SessionLog event. SessionLog events include the userId, email, and a timestamp.
A custom event is created when you capture and send an event to Splunk Observability Cloud. For example, you might send a custom “code push” event each time your development team deploys new code, so that you can correlate it with the resource consumption profiles of your infrastructure before and after the event.
Event types 🔗
Each event is an instance of an event type. An event type is a reusable event name that groups together events that you want to show as a stream or series, such as code pushes.
By reusing event types, you can add an event type to a chart, then view all events that occurred for that event type. You can also create custom events to record specific actions.
Valid values for events 🔗
Event values must meet certain criteria. Invalid payloads are dropped, and you can track them with org metrics such as sf.org.numEventsDroppedInvalidByToken. See more at View organization metrics for Splunk Observability Cloud.
These are the valid values for events:
Maximum length of the event type (or event name): 256 characters.
Maximum number of dimensions allowed for an event: 36.
Maximum length of the dimension key name of an event: 128 characters. For example, if a dimension’s key:value pair is (“mydim”, “myvalue”), ‘’mydim’’ is limited to 128 characters.
Maximum length of the dimension value of an event: 256 characters. For example, if a dimension’s key:value pair is (“mydim”, “myvalue”), ‘’myvalue’’ is limited to 256 characters.
Maximum number of properties allowed for an event: 1024.
Maximum length of the property key name of an event: 128 characters. For example, if a property’s key:value pair is (“myproperty”, “myvalue”), “myproperty” is limited to 128 characters.
Maximum length of the property value of an event: 256 characters. For example, if a property’s key:value pair is (“myproperty”, “myvalue”), ‘’myvalue’’ is limited to 256 characters.
Custom events 🔗
Custom events are usually generated through an integration with another service or through the REST API, and are sent to Splunk Observability Cloud when specific events happen outside it. Read more on custom events in our developer portal .
You can also create custom events manually, which you can display on charts alongside other events. See Create a new custom event manually.
Note
Custom events are retained in the platform for a year.
Create a new custom event manually 🔗
To create a new custom event:
From the Events sidebar, select New event.
In the Create Event dialog box, start typing to see a list of event types to choose from. You can also create a new event type by selecting the tooltip.
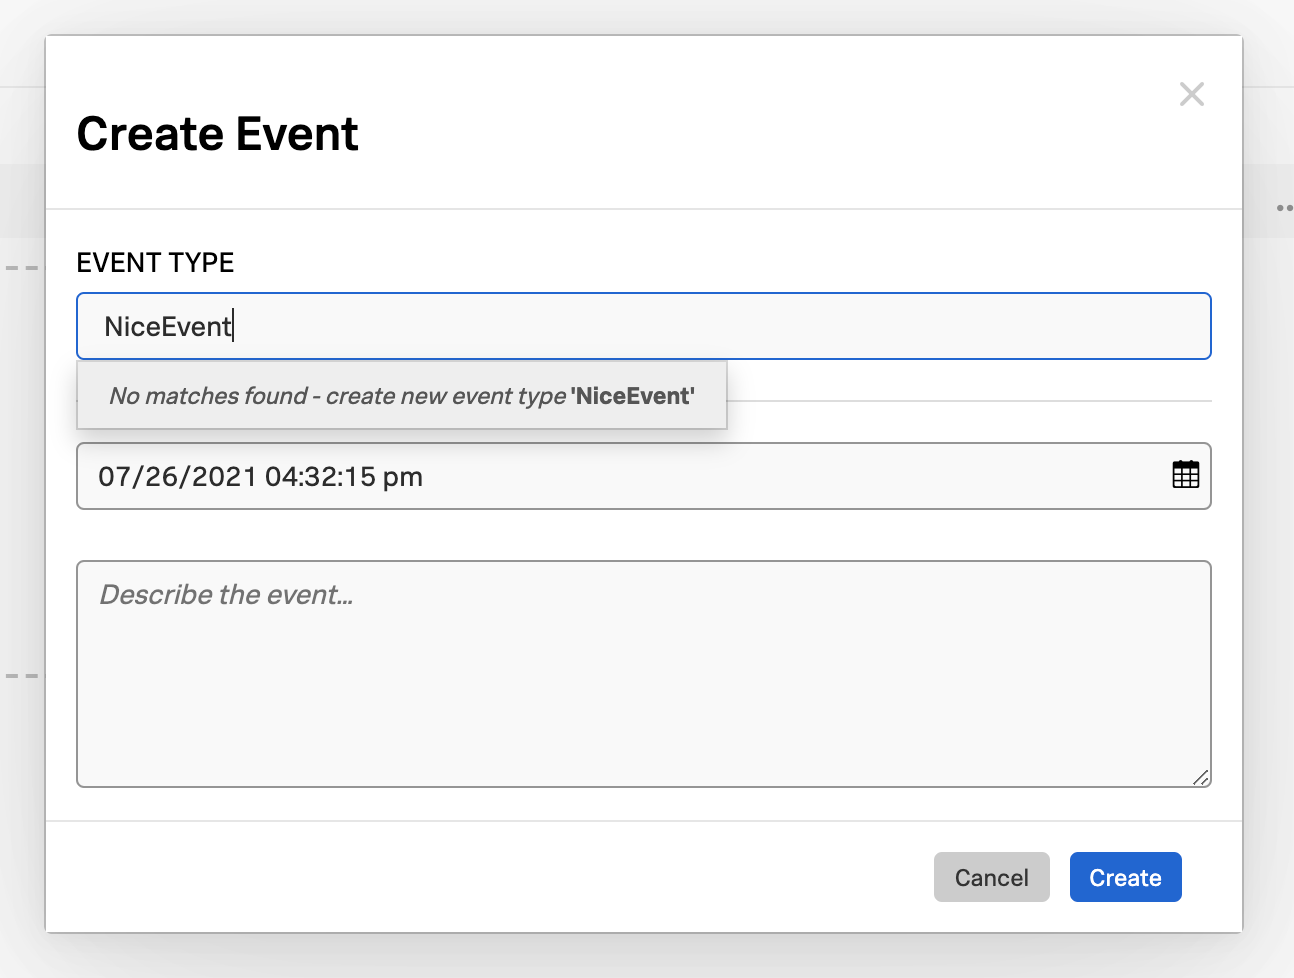
Enter the time and describe the event.
To save the new custom event and the event type (if you created one), select Create.
Note
Alternatively, you can also create the new custom event while using the Chart Builder. To learn more, see Manually add custom events.
Delete custom events 🔗
You can only delete custom events. Events generated by detectors can’t be deleted.
To delete custom events:
Locate and open the custom event:
In the Event Feed sidebar, available from within any dashboard, select a custom event.
When viewing or editing an event feed, select a custom event.
Select Mark For Deletion to delete the event.
Note
Events might not be deleted immediately.
View events 🔗
You can add any of the event types described in Events in Splunk Observability Cloud to a chart (see View events on a chart) or to an event feed chart on a dashboard.
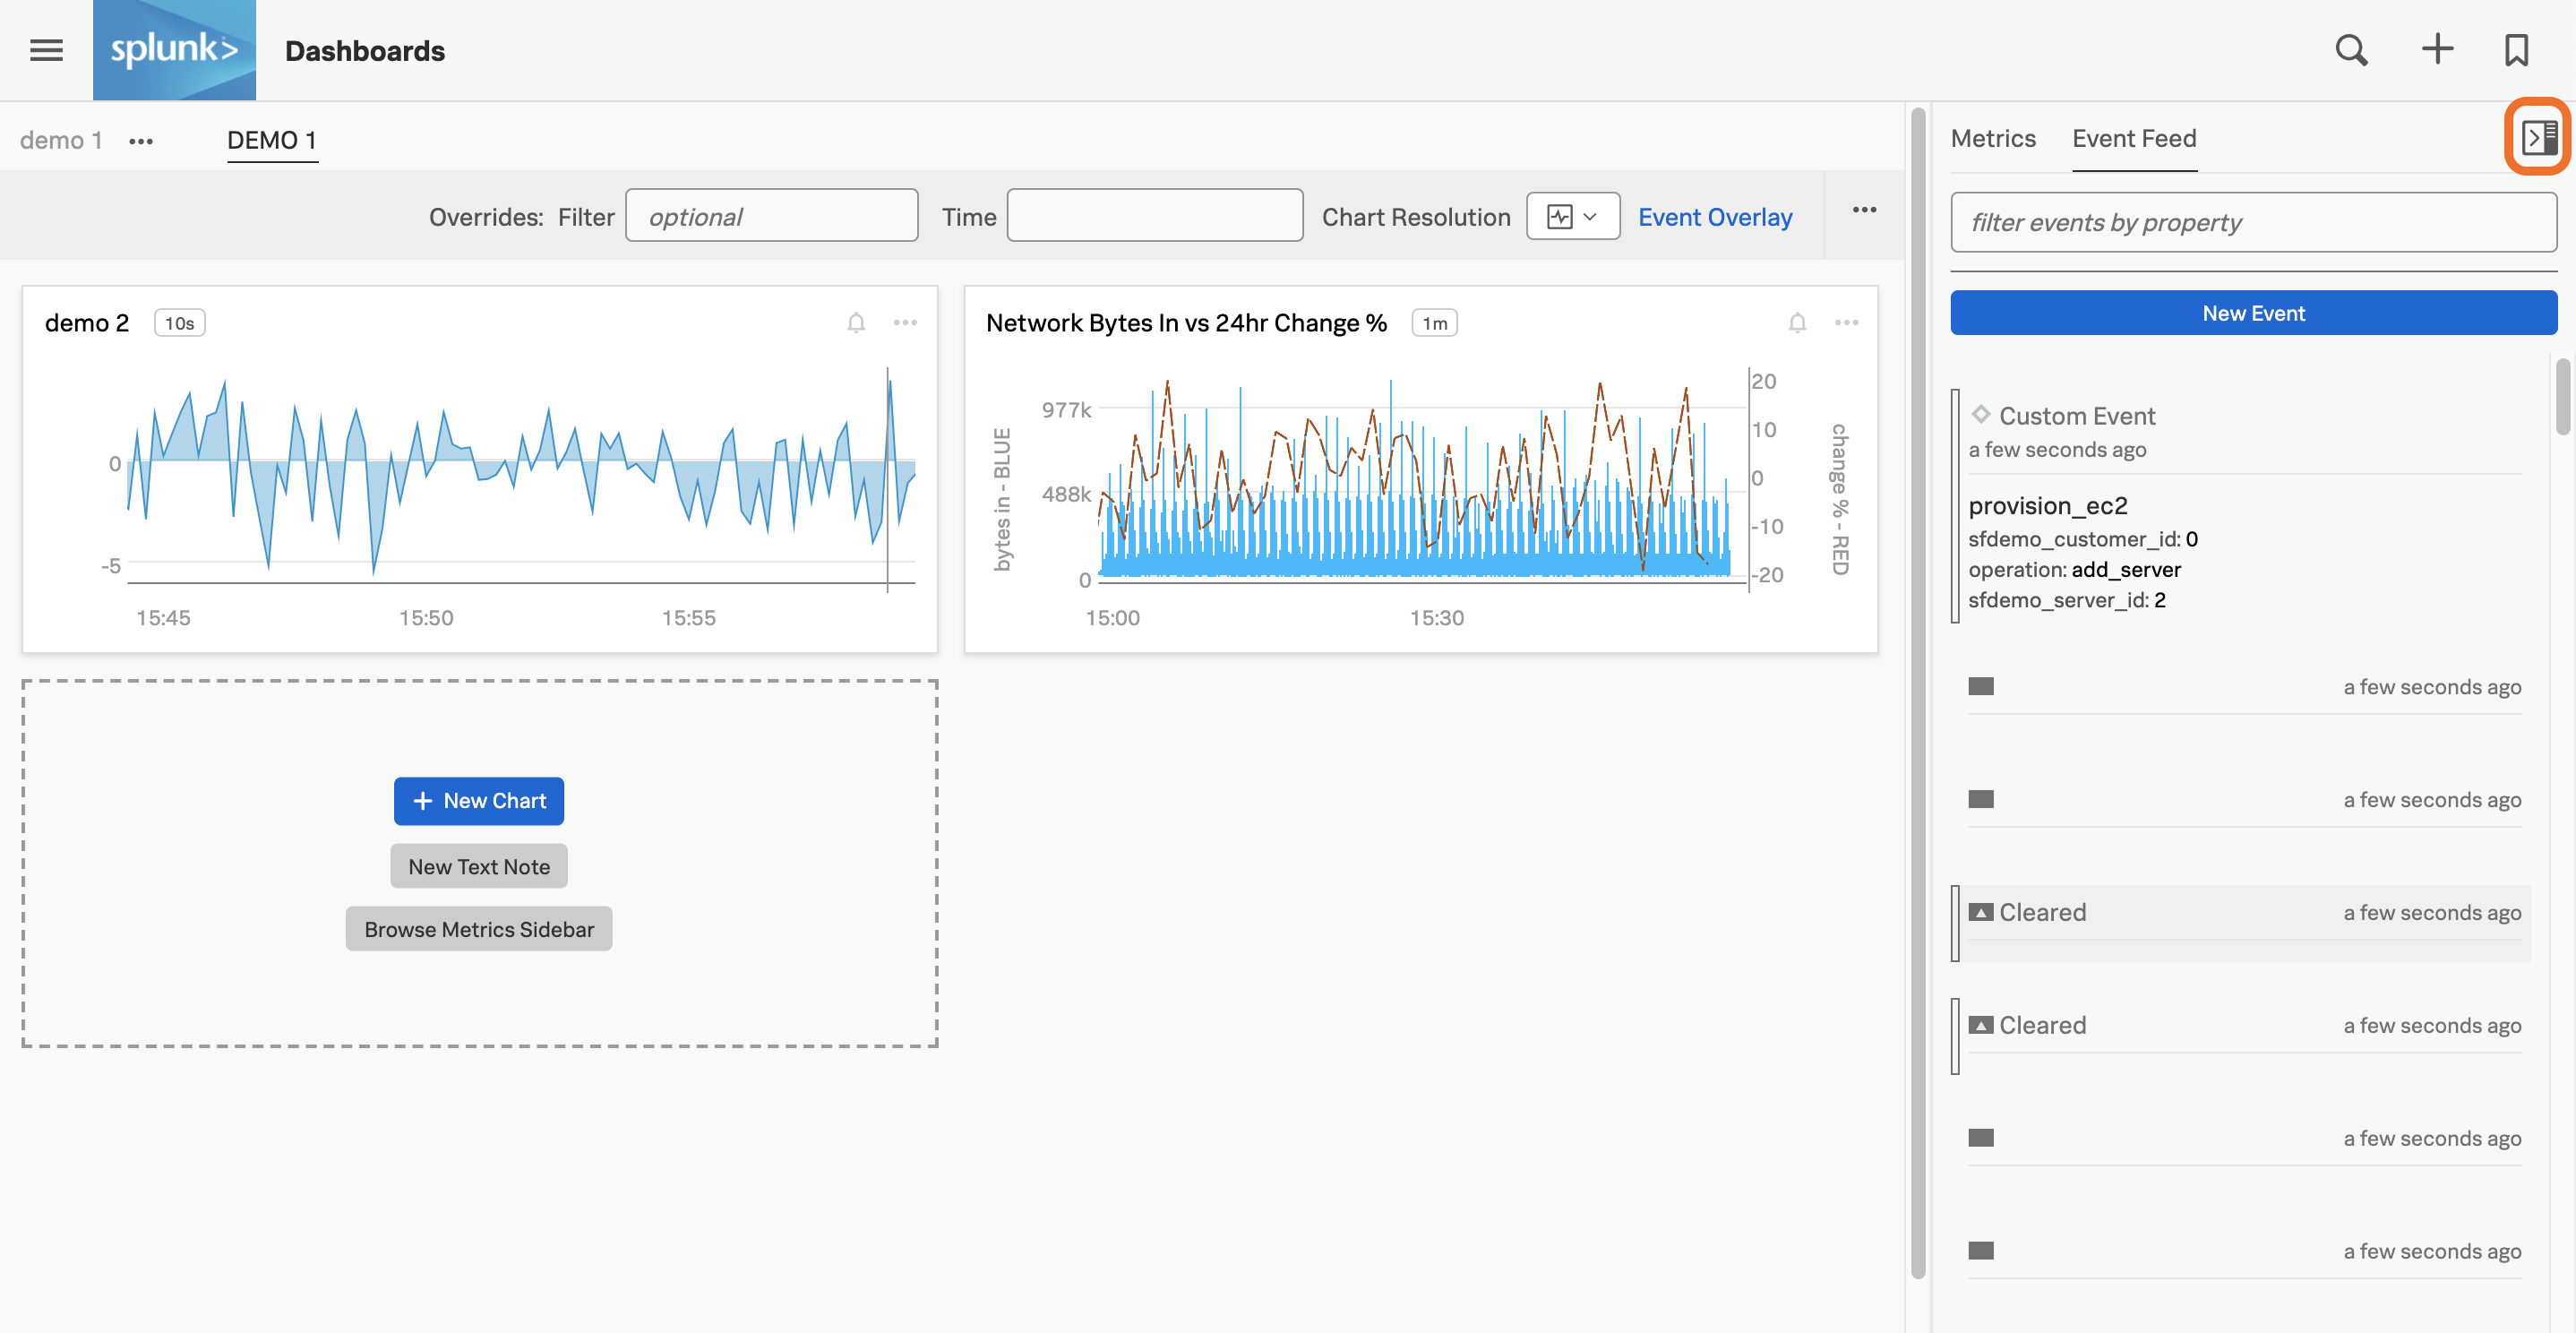
The events list in the sidebar indicates the severity of each event and whether it was a trigger event (solid triangle) or clear event (hollow triangle). The sidebar also indicates if an event was a custom event (hollow diamond).
When you hover over an event in the Event Feed sidebar, a vertical line is shown in all the charts at the time the event occurred. The event line makes it easy for you to visualize correlations between metric values and the event.
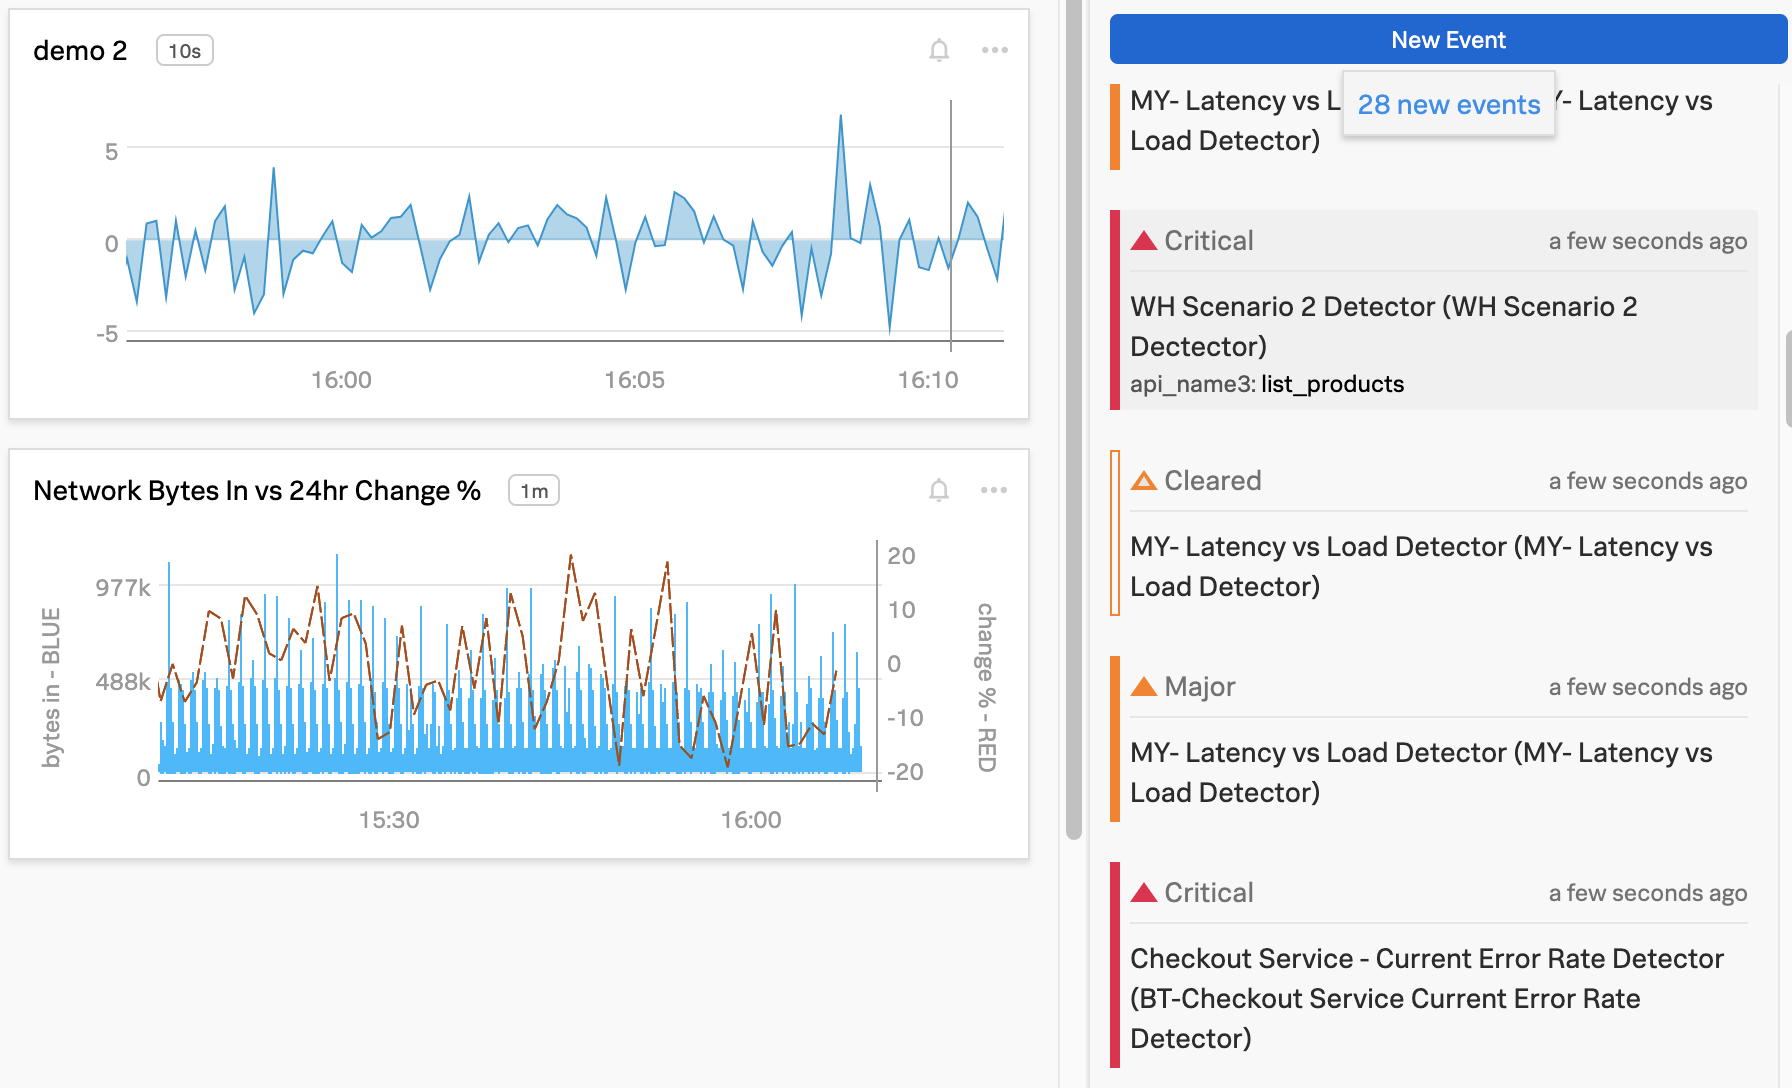
When you select an event in the Event Feed sidebar, you can see details about the event and, for events associated with alerts, an option to open the detector that generated the event. If the event is associated with a currently active alert, you’ll also see an option to resolve the alert.
Note
You can also overlay event markers onto charts on a dashboard.
Events retention in Splunk Observability Cloud 🔗
All types of events have a retention period of 12 months.