Create detectors to trigger alerts 🔗
A detector monitors signals on a plot line and triggers alert events and clear events based on conditions you define in the detector rules. Think of a detector as a chart that triggers alerts when a signal’s value crosses specified thresholds defined in alert rules.
Detectors are made up of alert rules. When you create an alert rule you can select various built-in alert conditions to define thresholds that trigger alerts. See Built-in alert conditions.
When a detector determines that the conditions for a rule are met, it triggers an alert, creates an event, and sends notifications, if specified. Detectors can send notifications through email, as well as through other systems, such as Slack, or by using a webhook. To learn more, see Send alert notifications to services using Splunk Observability Cloud.
You can find active alerts, existing detectors, and muting rules under Detectors & SLOs. You can also find alerts in the Events Feed, available within any dashboard.
Note
This topic covers Infrastructure and Custom Metrics detectors. You can create a Splunk APM detector to monitor request rates, error rates, and latency for your service. To learn more about Splunk APM detectors, visit Configure detectors and alerts in Splunk APM.
Create detectors 🔗
The high-level steps for creating a detector are:
Create alert rules to the detector to specify when to trigger alerts.
Choose how to create a detector 🔗
There are several ways to create a detector.
You can clone an existing detector if you have existing detectors that you want to modify. See Clone an existing detector.
You can customize AutoDetect detectors. See Copy and customize an AutoDetect detector.
Create a detector from one of the signals on the chart you’re viewing. See Create a detector from a chart.
Create a detector from scratch. See Create a detector from scratch.
Use the API to programmatically create detectors, instead of creating them through the user interface. See Create a detector using the API.
Clone an existing detector 🔗
You can see a list of existing detectors on the Detectors tab of the Detectors & SLOs page.
Look for a detector that is similar to the detector you want to create.
Select the detector.
Select from the actions menu (⋯).
Next, see Create alert rules for your detector.
Create a detector from a chart 🔗
If there is a chart that monitors a signal that you want to alert on, you can use that chart to create a detector. Creating a detector from a chart pre-selects one of the chart’s signals as the signal to be monitored.
Follow these steps to create the detector:
Select the bell icon on a chart.
Select .
To continue, see Create alert rules for your detector.
After you create a detector from a chart, the detector is automatically linked to the chart.
Create a detector from scratch 🔗
To create a new detector from scratch, you can either select Create detector on the Detectors & SLOs page, or select from the create menu on the navigation bar. Enter a detector name and then select Create alert rule to proceed to the alert rule builder. For instructions on building the rule, see Create alert rules for your detector.
Create a detector using the API 🔗
Using the API to create a detector provides a number of capabilities that are not available in the UI, letting you build detectors with more advanced rules and conditions. You can view these detectors in the UI. The program text appears in place of the signals displayed in standard detectors.
For general information on creating detectors using the API, see the Detect Anomalies with Detectors topic in the Splunk Observability Cloud Developer Guide.
For information on using the UI to edit detectors created using the API, see Edit detectors through the SignalFlow tab.
Note
If a detector display includes a SignalFlow tab, you are viewing a detector created programmatically using the Splunk Observability Cloud detectors API . If you are familiar with that API, you can use the detector display to view and edit the detector code and make changes to the detector rules.
Create alert rules for your detector 🔗
To configure a new alert rule for your detector, follow these steps:
On the Alert signal tab, select one or more signals to monitor for unusual behavior. To learn more, see Select alert signals.
On the Alert condition tab, select the alert condition. See Alert condition.
On the Alert settings tab, complete the alert condition using the settings available. The settings that are available are based on your selection on the Alert condition tab. See Alert settings.
On the Alert message tab, select the alert severity, customize the alert message, and a runbook or tip. See Alert message.
On the Alert recipients tab, add recipients who you want to receive a notification through email or other third-party integration. See Alert recipients.
On the tab, you name the rule and activate the detector. See Activate.
After you activate the detector, it begins monitoring the signal immediately. When the signal meets the specified criteria, the detector triggers alerts, creates events, and sends the specified message to the alert recipients.
Note
If you don’t see the Alert signal, Alert condition, or Alert settings tabs, you are viewing a detector created through the API. For more information, see Edit detectors through the SignalFlow tab.
Select alert signals 🔗
On the Alert signal tab, define the signal to monitor by entering a metric and corresponding analytics.
If you are creating a detector from scratch, you have to first select the signals you want to monitor. Selecting a signal for a detector is similar to selecting a signal in a chart in the Chart Builder. Enter a metric and select the metric you want to monitor from the list. Add filters or analytics. To add more signals, select Add Metric or Event or Add Formula. You can add events to be displayed on the chart, but you cannot select an event as the signal to be monitored. To learn more, see Specify a signal for a plot line.
Note
When you select an archived metric as a signal in your detector, the archived metric can’t be report data to your detector and will cause the detector to misfire alerts or stop working. To include an archived metric in detectors, route them to real-time or create exception rules to make them available. For more information, see the Use routing exception rules to route a specific MTS or restore archived data section.
If you are creating a detector from a chart or by cloning a detector, you might not need to add new signals. However, if you do add new signals to the detector, the signals you add are not added to the original chart or detector.
You can add events to be displayed on the chart, but you can’t select an event as the signal to be monitored.
If the detector has multiple signals, select what signal you want to alert on.
To monitor one signal, select the bell icon in the Alert on column to select which signal you want to monitor. A blue bell indicates the signal that is being monitored.
To create compound conditions based on the values of more than one signal, for example, signal A is higher than
xOR signal B is higher thany, select the Monitor multiple signals double-bells icon. When you select to monitor multiple signals your alert condition is changed to Custom Threshold.
Note
If you don’t see the Alert signal tab, you are viewing a detector created through the API. For more information, see Edit detectors through the SignalFlow tab.
Select alert conditions 🔗
On the Alert condition tab, select the type of condition that triggers an alert. If you want to create compound conditions using AND or OR operators on the Alert settings tab, you must use the Custom Threshold condition. This applies whether you are monitoring a single signal or multiple signals.
See Built-in alert conditions for the list of the available built-in alert conditions for Infrastructure Monitoring and Custom Metrics detectors.
After you have selected the alert condition, continue to the next tab to specify the settings that trigger alerts.
Note
If you don’t see the Alert condition tab, you are viewing a detector created through the API. For more information, see Edit detectors through the SignalFlow tab.
Specify alert settings 🔗
On the Alert settings tab, specify the settings that trigger an alert. The available settings vary depending on the alert condition you selected. See Built-in alert conditions for the settings available for each built-in condition.
If you are using the Custom Threshold condition, you can select Add another condition to create compound conditions using AND and OR operators. For more information about compound conditions, see Custom threshold.
In the chart, use a preview of the alerts that are triggered based on the settings you selected. For more information on using the preview, see Preview detector alerts.
After you have specified settings for triggering alerts, continue to the next tab to create a message that is sent when the alert is triggered.
Note
If you don’t see the Alert settings tab, you are viewing a detector that was created using the API; alert settings are defined in the SignalFlow tab.
Alert messages 🔗
On the Alert message tab, specify the severity of the alert and the information you want to include in the notification message.
Severity 🔗
Specify the importance of the alerts generated by this rule. Splunk Observability Cloud has five severity labels: Critical, Major, Minor, Warning, and Info. Each severity label has a different color, and event markers appear on charts in the associated color.
You can create multiple rules to generate alerts with different severity levels for similar conditions, for example:
Critical alert for the alert condition Resource Running Out set to low trigger sensitivity
Major alert for the same condition set to medium sensitivity
Minor alert for same the condition set to high sensitivity
Another example might be:
Critical alert for the alert condition Heartbeat Check where the value for Hasn’t reported for is 60 minutes
Major alert for the same condition set at 30 minutes
Minor alert for same the condition set at 15 minutes
The easiest way to do this is to create a rule at one severity, select from the actions menu (⋯), and then edit the settings and severity.
Message preview 🔗
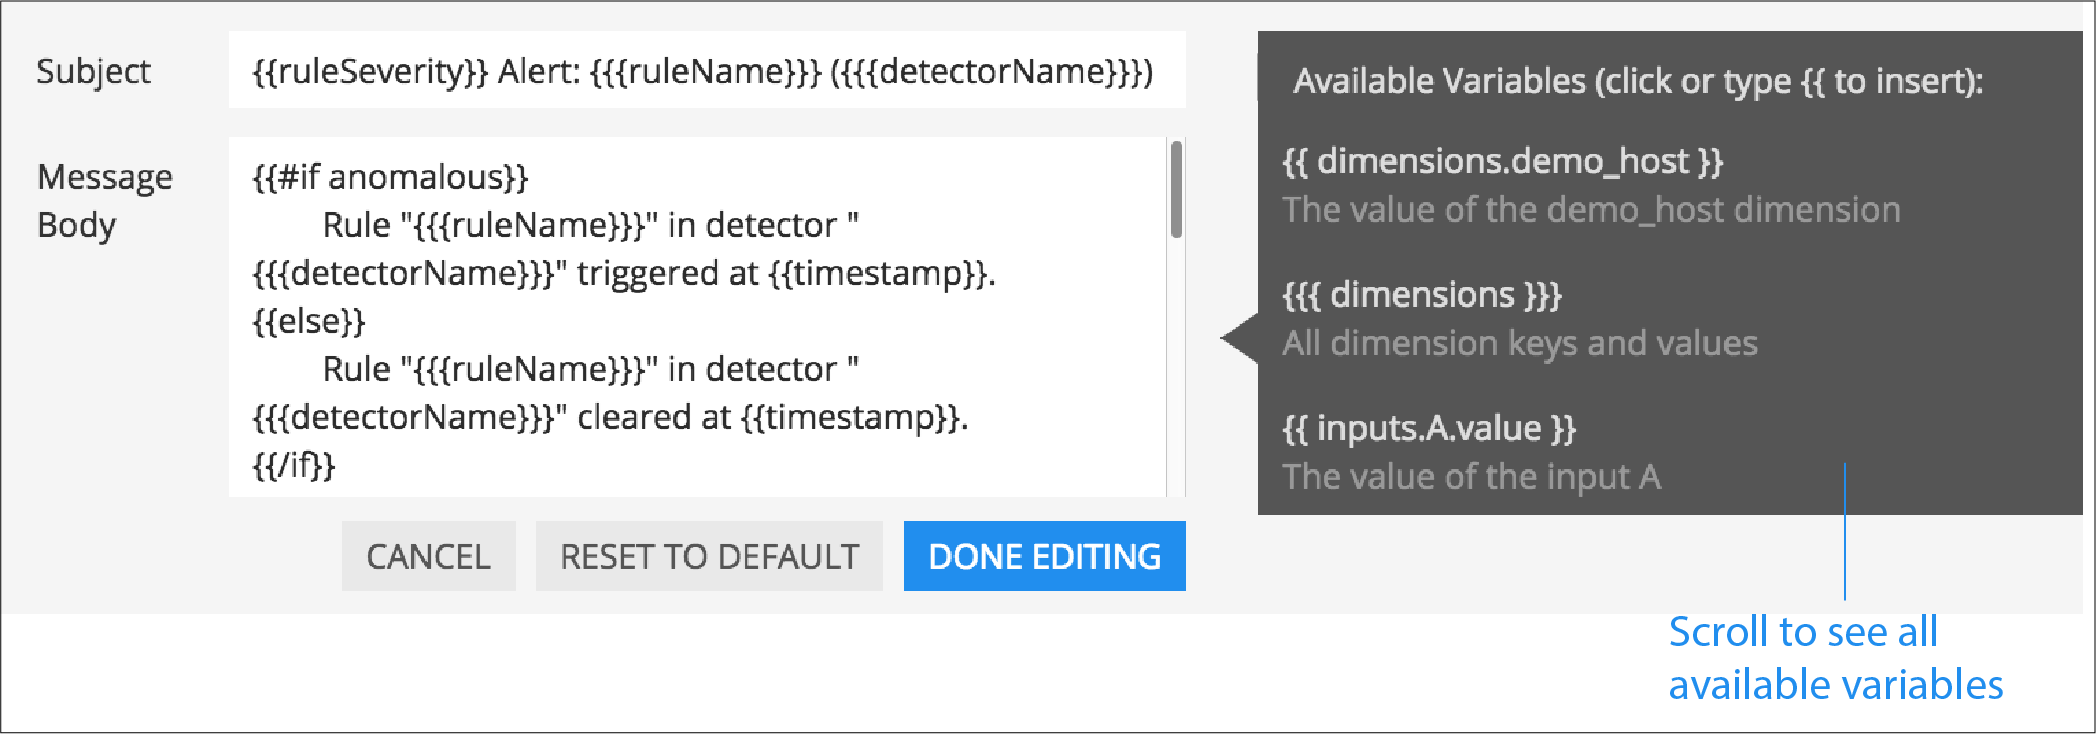
Displays a default message that is sent when an alert is triggered or cleared. To edit the subject or the content of the message, select Customize; you can see the code and variables used to construct the message. Available variables are shown to the right of the message area while you are editing the message. Use triple braces where indicated so that the variable value is not escaped.
Note that the use of variables is supported only in the message subject and body, not in the Runbook or Tip fields.

You can also use Markdown in the message.
When entering a variable in the message, enter the first few characters to narrow down the list of variables. Select Tab to add the first variable in the list to the message.
See Alert message variables reference to see all variables and helper functions you can use when creating a custom message.
After you have created an alert message, continue to the next tab to specify where alert messages will be sent.
Display custom properties 🔗
If you are creating a detector using the Splunk Observability Cloud API, you can convert custom properties to dimensions using the promote() method.
By converting a custom property to a dimension, you can display it in an alert message. To learn more, see the Developer documentation for the promote method .
For more information about the detector API endpoints, see Detectors Splunk Observability Cloud API reference.
Alert recipients 🔗
On the Alert recipients tab, specify who receive notification messages when alerts are triggered or cleared. Recipients are subscribers to a rule. Adding recipients is optional, but often useful.
If you have previously integrated your alerts with another system, those options appear in the Add Recipient dropdown menu. You can also send to email addresses, webhook URLs, and Create and manage teams. Notifications are also sent when a condition clears.
The following table explains different types of email notifications:
Email notification |
Description |
|---|---|
Stopped |
The detector is muted or disabled when the alert is triggered |
Back to normal |
The alert is cleared |
Manually resolved |
The alert is manually set as |
Auto-cleared |
The Auto-clear setting is applied to the detector and the specified duration has elapsed. To learn more, see Auto-clear alerts |
Note
Tips
If you want to add the same subscribers to each of multiple rules, you can add the subscribers to all rules at once by using the Manage subscriptions option on the Detectors tab under Detectors & SLOs after you save the detector.
You can temporarily stop a detector from sending notifications by muting notifications.
Activate 🔗
On the Activate tab you see a summary of the detector settings you specified. Review the summary and make any necessary changes in the associated tabs, then name the rule. By default, the rule name is the same as the detector name. The rule name is displayed on the Alerts page and in notifications.
Select Activate Alert Rule to save the detector and begin monitoring the specified signal. After you activate the detector, the Alert Rules tab of the detector is displayed, showing the signal you selected and a summary of the rule you built. You can edit the detector name; the text you enter here is displayed as the detector name on the Detectors tab under Detectors & SLOs. You can also provide additional descriptive text to clarify the purpose of the detector for others.
Note
If you make any changes to the detector name or description, select the Save button. If you select the Close button without saving, your changes will be lost.
Edit detectors through the SignalFlow tab 🔗
Note
This section assumes you are familiar with the Splunk Observability Cloud detectors API .
If you are modifying a detector that was created using the API, you can add and edit detector rules using the SignalFlow tab. The SignalFlow program text replaces the Alert signal, Alert condition, and Alert settings tabs that are used when creating and editing detectors using the UI.
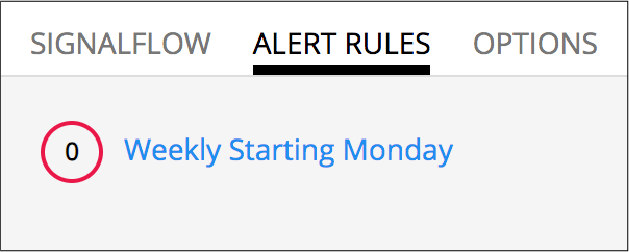
Every publish statement in a SignalFlow detect statement corresponds to a rule on the Alert Rules tab. The label you enter inside the publish block is displayed next to the number of active alerts displayed on the Alert Rules tab.
For example, this SignalFlow detect block:
detect(when(A > 1000)).publish('Weekly Starting Monday')
looks like this on the Alert Rules tab:

If the detector contains data blocks that correspond to plot lines in the detector’s chart, such as:
A = data('cpu.idle'.publish(label='CPU idle')
then the labels are displayed on the right side of the screen on the SignalFlow tab. For a label to be displayed, the data block must include a publish block.

Select the gear icon to display options you can specify for the plot line shown in the detector’s chart.

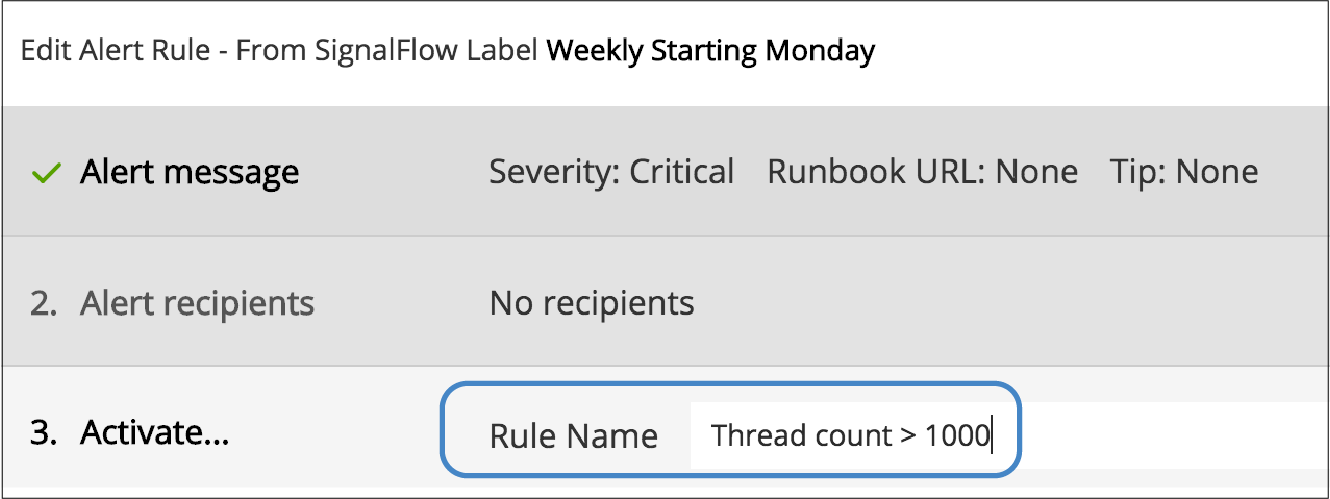
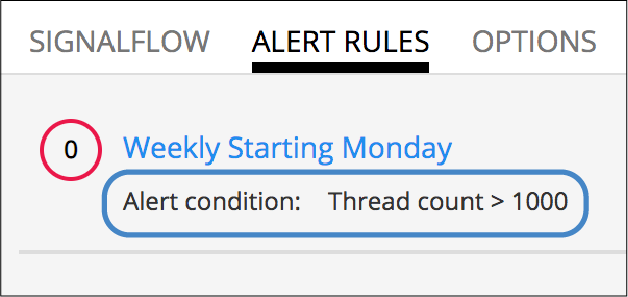
To add or edit the alert message, recipients, or rule name, use the Edit button on the Alert Rules tab. The rule name you add on the Activate tab is displayed on the Alert Rules tab. The rule name is also shown as the alert condition on the Alerts page and in alert notifications.
For example, this rule name on the Activate tab

looks like this on the Alert Rules tab:

For more information about editing detector options on the Alert Rules tab, see Alert messages, Alert recipients, and Activate.
Manage alert rules 🔗
On the Alert Rules tab of a detector, you can use the actions menu (⋯) menu for a rule to deactivate, activate, clone, or delete an alert rule.
Note
The options to clone or delete rules are not available for detectors created using the API.
Activate or deactivate alert rules 🔗
If a detector has multiple rules, such as different rules for different severity levels, you can specify which ones to activate or deactivate. Deactivating a rule prevents it from generating any events or sending any notifications. Use this option to decrease or increase the number of alerts the detector is triggering.
Note
Deactivating an alert rule also clears any of its active alerts.
Clone alert rules 🔗
As with plot lines on charts, you can clone rules. This option is commonly used to create rules with slightly different settings from each other, such as specifying a different value for the Alert condition property or changing the severity level of an alert.
Delete alert rules 🔗
Use this option to remove a rule from the detector.
Tag a detector 🔗
Use tags to indicate the state of a detector, its data source, or any other property you want to label. For example, you can tag a detector with prod to indicate that it monitors a production environment.
You can tag detectors from the list view. To see a list of detectors and add tags, do the following:
To open the list view, open the Detectors & SLOs page, then select the Detectors tab.
Select the actions menu (⋯) for the detector you want to assign tags to.
Select Edit tags.
Enter tags for the detector. You can add no more than 20 tags per detector.
Select Save.
Link teams to a detector 🔗
Link teams to a detector to indicate which team is responsible for the maintenance and monitoring of the detector. Teams associated with a detector can see the detector and its active alerts on the team’s landing page.
To link teams to a detector, select the detector actions menu (⋯), either from the list view of the individual detector view, then select Link to teams. You can link no more than 20 teams to a detector.
Note
The list of teams linked to a detector is independent of notification settings. Associated teams don’t automatically get notified of new alerts. To configure notifications, see Manage notification subscribers.
Set detector permissions 🔗
To protect detectors from being edited or deleted by other members of your organization, you can specify which users and teams have permissions for them. For more information, see View and manage permissions for detectors.