Preview detector alerts 🔗
Setting up the right alerts is usually a process of trial and error. You set up an alert, get notified when it is triggered (or worse, don’t get notified when it should have triggered), adjust the trigger condition if necessary, and wait for the next alert. Splunk Infrastructure Monitoring provides an alert preview functionality that accelerates this trial and error process. (If you are using the Splunk Observability Cloud API to manage detectors, this feature corresponds to the POST /v2/signalflow/preflight API endpoint.)
How alert preview works 🔗
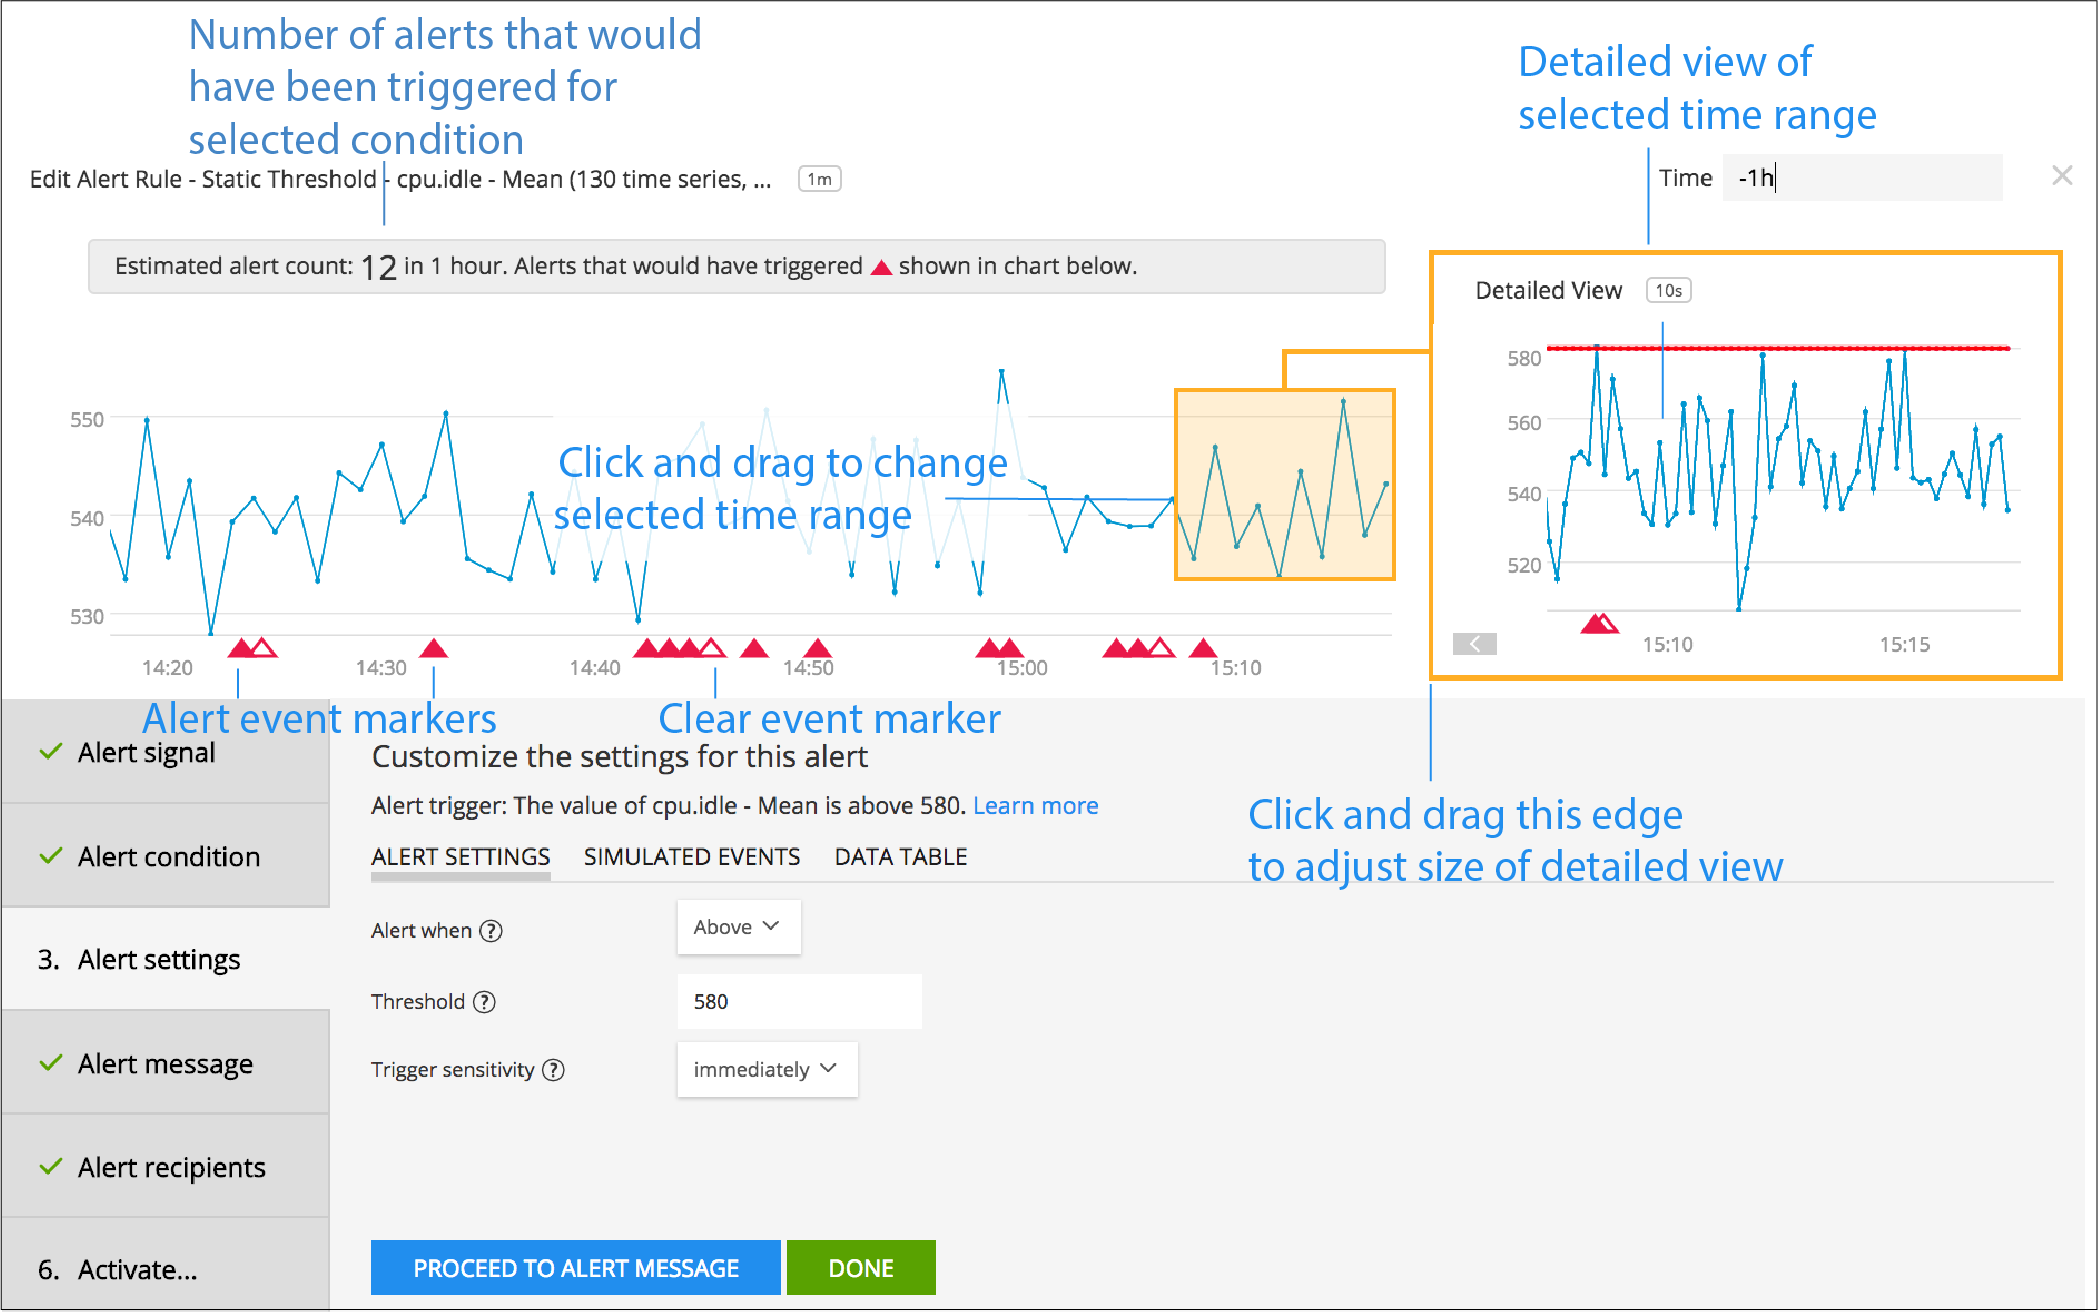
When you go to the Alert Settings tab while creating or editing a detector rule, Splunk Infrastructure Monitoring runs the settings against your data and generates a preview chart to help you decide whether your settings are appropriate for your requirements. The preview indicates when alerts would have triggered during the time range specified in the detector. You can use the preview to fine-tune the settings that will trigger the alert, to assure that you will receive the alerts you expect when you expect them.

Note
If you are editing a detector created using the API, alert preview is available while you are managing rules using the Alert Rules tab. The preview is triggered when you are editing the SignalFlow text or when you change the time range of the detector.
Data displayed in the chart may be rolled up based on the detector’s time range. The detail view displays data at detector resolution for the selected time period on the chart; that is, data points are shown at the frequency with which the detector is monitoring the signal to determine whether an alert should be triggered or cleared. This view lets you see exactly what data the detector is viewing for the period selected in the chart. You can select and drag the left edge of the detail view to enlarge it and gain more visibility into the data.
You can navigate between tabs while the preview is shown. For example, you might want to go to the Alert Signal tab and look at the Data Table to review the values of your signal before, during, and after the time an alert would be triggered.
Note
A preview can be generated for a period of time up to the previous 1 week (-1w). If the time range on the detector is greater than one week (in other words, if you have specified -31d to see data for the previous month), the preview will display alert markers only for the previous 1-week period.
The following sections provide examples of how you can use the preview function to tailor detectors to your requirements.
Modify an existing detector based on past activity 🔗
If you already have detectors triggering alerts in your system, you may find that some of them are either too sensitive (they trigger alerts too often) or are not sensitive enough (they don’t trigger alerts when you want to be notified about an issue). In either case, you can use the preview option to modify a detector’s settings so it triggers the appropriate number of alerts.
To use the preview option for the detector, open the detector and set a time range of, for example, -1w to display all alerts that were triggered in the last week. (Alternately, you can set a shorter time range that better represents the issue you are addressing). Display the Alert Rules tab, edit the alert condition, and open the Alert Settings tab. The chart display changes from showing actual past alerts (if any) to showing a preview of alerts that would have triggered based on the alert condition.
Depending on the type of alert condition, you have different options for making the detector more or less sensitive. For example, if you see more markers than you think you should (alert is too flappy), you might be able to change Trigger Sensitivity from High to Medium or Low, or you might be able to change the sensitivity from triggering immediately to triggering after a period of time. For many alert conditions, you can choose Custom for Trigger Sensitivity, which gives you more control over when alerts will be triggered.
As you make these changes, the preview is updated and the chart will display the number of alerts that would have triggered based on your new settings. When you have modified the detector to more accurately reflect the desired behavior, select Activate` and then update the alert rule.
Note
When you save a detector with modified alert conditions, the status of any currently active alerts will be set to “Stopped”.
Create a new detector based on a recent alert 🔗
Suppose a signal spiked in the past couple of hours, and you are creating a new detector to monitor for that spike. You would add the signal that spiked on the Signals tab, then choose an appropriate condition on the Alert Conditions tab.
Note
If you already have a chart that includes the signal as a plot line, you can create a detector from the chart instead of creating a new detector from scratch. Choose that signal when you begin creating the rule in the Alert Conditions tab.
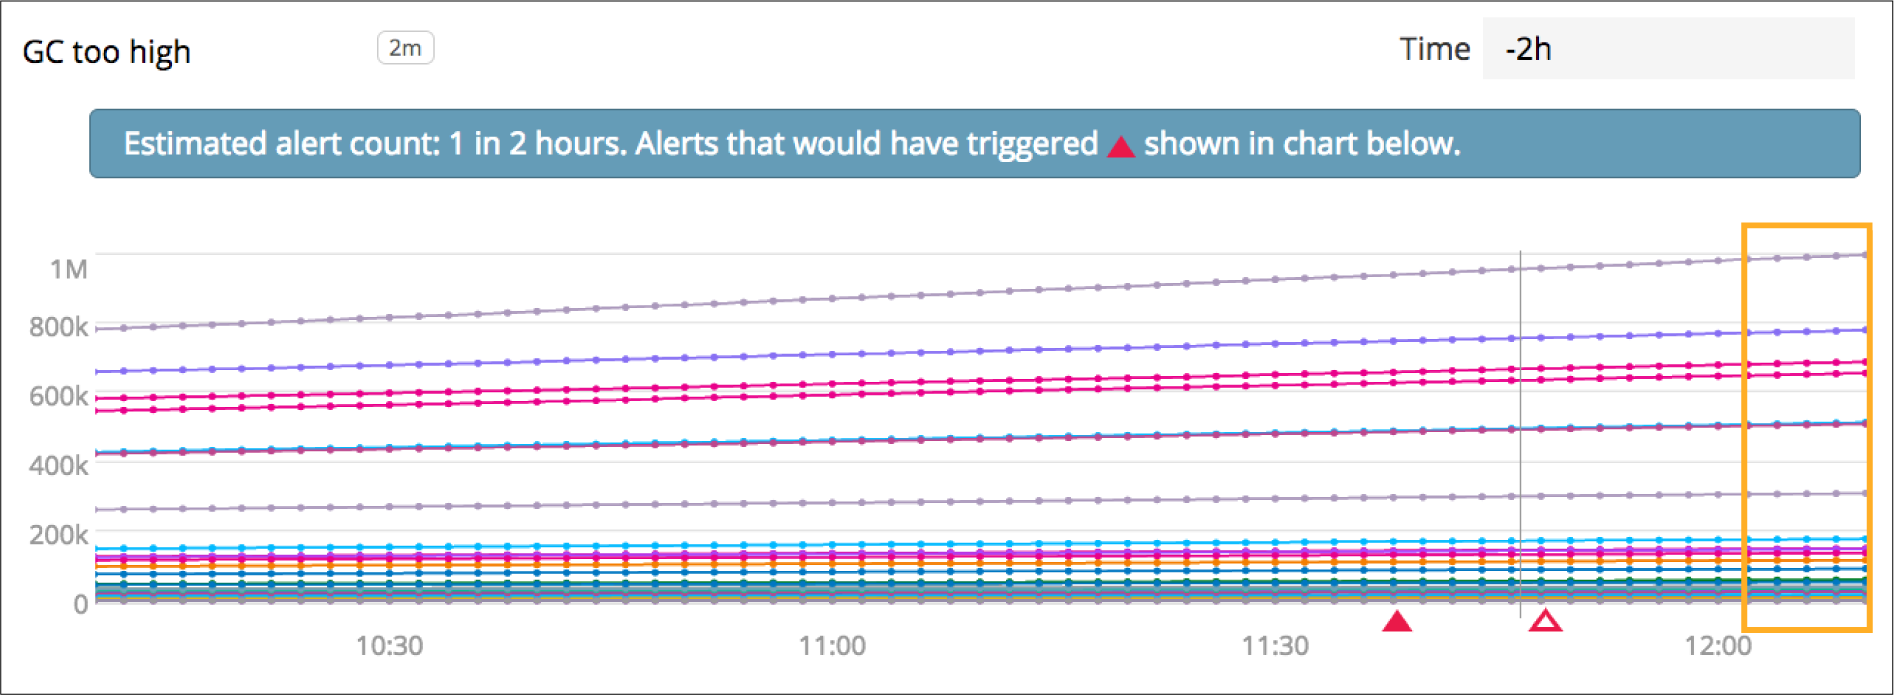
In this example, we set the time range of the detector to -2h, named the detector and the new rule, and chose the Sudden Change condition, which compares recent values with earlier values. Based on the trigger sensitivity (the default is Low), the preview chart shows event markers for times when the alert would have been triggered during the past week; you should see an event marker for the time the spike occurred. You might also see markers for other times the signal spiked in the past week, as well as markers indicating the alert condition cleared.

You have different options for adjusting sensitivity depending on the type of alert condition you are using.
Create a new detector based on recent signal values 🔗
In this example, we are setting a condition with a static threshold. When looking at the chart, we chose a threshold value that looked about right. However, the preview indicates that we would have received 11 alerts in the previous day.

When we increase the threshold value, the number of projected alerts is reduced.

Adjust settings until you see a preview that makes sense for your data. For a static threshold condition, you can adjust the threshold value, but you can also adjust how quickly the alert is triggered. To learn more, see Static Threshold. Use these settings in combination to customize the detector for your requirements.
You have different options for adjusting sensitivity depending on the type of alert condition you are using.