Splunk RUM custom dashboards 🔗
Create a custom dashboard for any Splunk RUM metric.
In the left navigation menu, select > +> Dashboard
Select the charts you want to create with the metrics of interest to you. For more information, see Create and customize dashboards.
Save your dashboard.
Metrics 🔗
The following metrics are available in Splunk RUM. All errors in Splunk RUM have the dimension sf_error=true.
Page level dashboards 🔗
Metrics with the prefix rum.node. are page level metrics, whereas metrics with the prefix rum. are application level metrics.
For example, rum.node.workflow.count represents the total number of spans with the selected custom event in the given time range sorted by page. Page level metrics also have a dimension sf_node_name, which you can use to filter on specific pages.
Use case 🔗
The following use case features an example from Kai, a site reliability engineer at Buttercup Industries, a fictitious e-commerce company.
Monitor custom events and page level metrics 🔗
Kai uses custom dashboards to get a high level assessment of the health of the Buttercup Industries applications. They go to to create a new dashboard. Kai wants to look at custom events and page level metrics for page views. The first chart utilizes the metric rum.node.workflow.count. The second chart shows the metric rum.node.page_view.count which shows custom events and page level metrics for page views. Here is how Kai set up their dashboard:
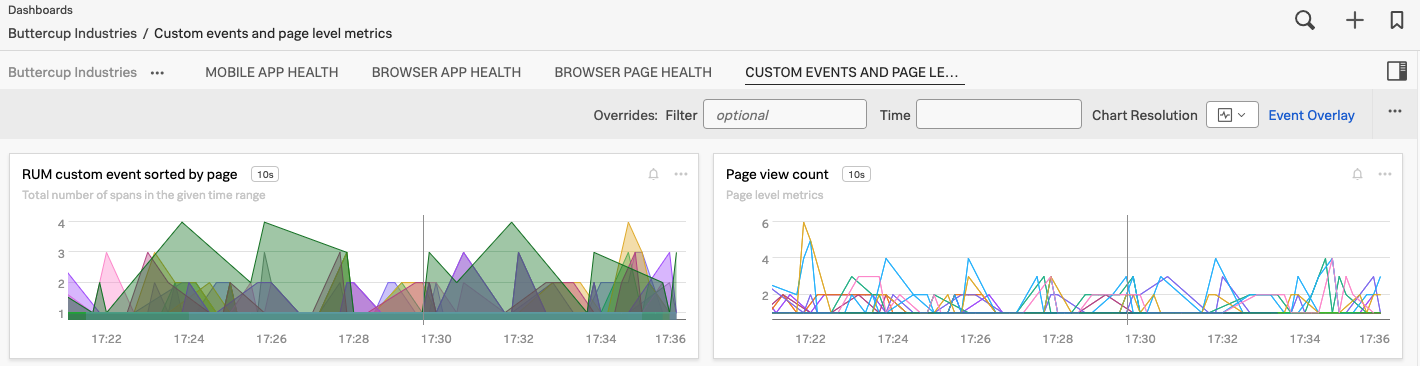
With this dashboard Kai can monitor custom events and page level metrics.