Scenario: Kai monitors infrastructure and apps in a cloud environment using the Splunk OTel Collector 🔗
Kai is the lead site reliability engineer in a large fintech company, PonyBank. Their task is to monitor their AWS infrastructure, which consists of several hundred containers running Java applications on Amazon Elastic Kubernetes Service (EKS). Kai also wants to instrument tens of Linux and Windows Elastic Compute Cloud (EC2) instances managed by IT. Kai’s primary goal is to extract reliability and performance metrics and logs from each asset, as well as to instrument the Java application in order to monitor its performance using Splunk APM.
PonyBank uses Splunk Observability Cloud, which brings data in through the open-source Splunk Distribution of the OpenTelemetry Collector, an agent that can collect and export data from multiple sources. The Splunk OTel Collector can also forward logs and traces to enable full software observability.
To instrument their infrastructure using the Splunk OTel Collector, Kai takes the following steps:
Since their migration to the cloud, the PonyBank application has been running in EKS. Kai starts by setting up the cloud integration from Splunk Observability Cloud using the guided setup, which they access from the home page. Guided setups allow Kai to select the relevant ingest token, and generate installation commands and configuration snippets from the selected options, which Kai can use to quickly deploy instrumentation.
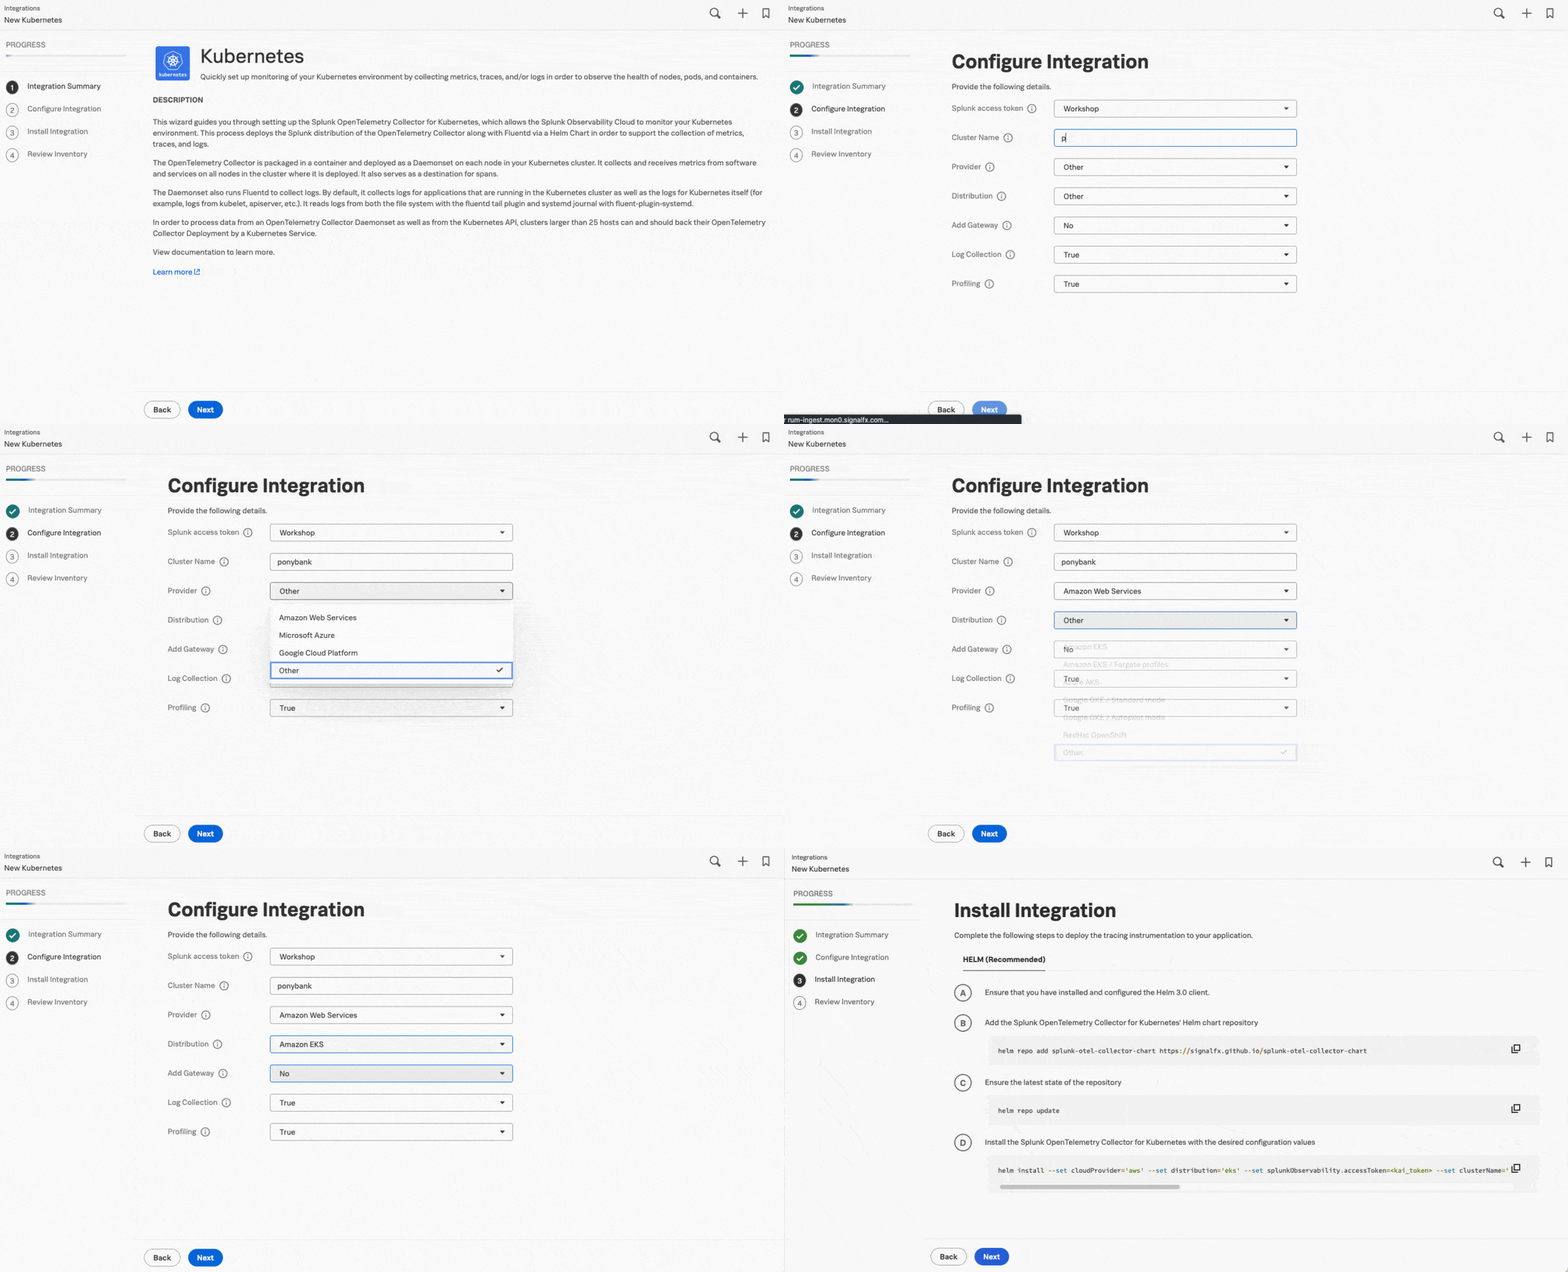
As the cluster contains hundreds of containers in a virtual private cloud (VPC) with no direct access to the cloud, Kai uses the guided setup to add a cluster of Splunk OTel Collector instances in data forwarding (gateway) mode, so that they can receive and forward data while preserving the safety of the original configuration. In the next step, the guided setup provides customized commands for Helm.
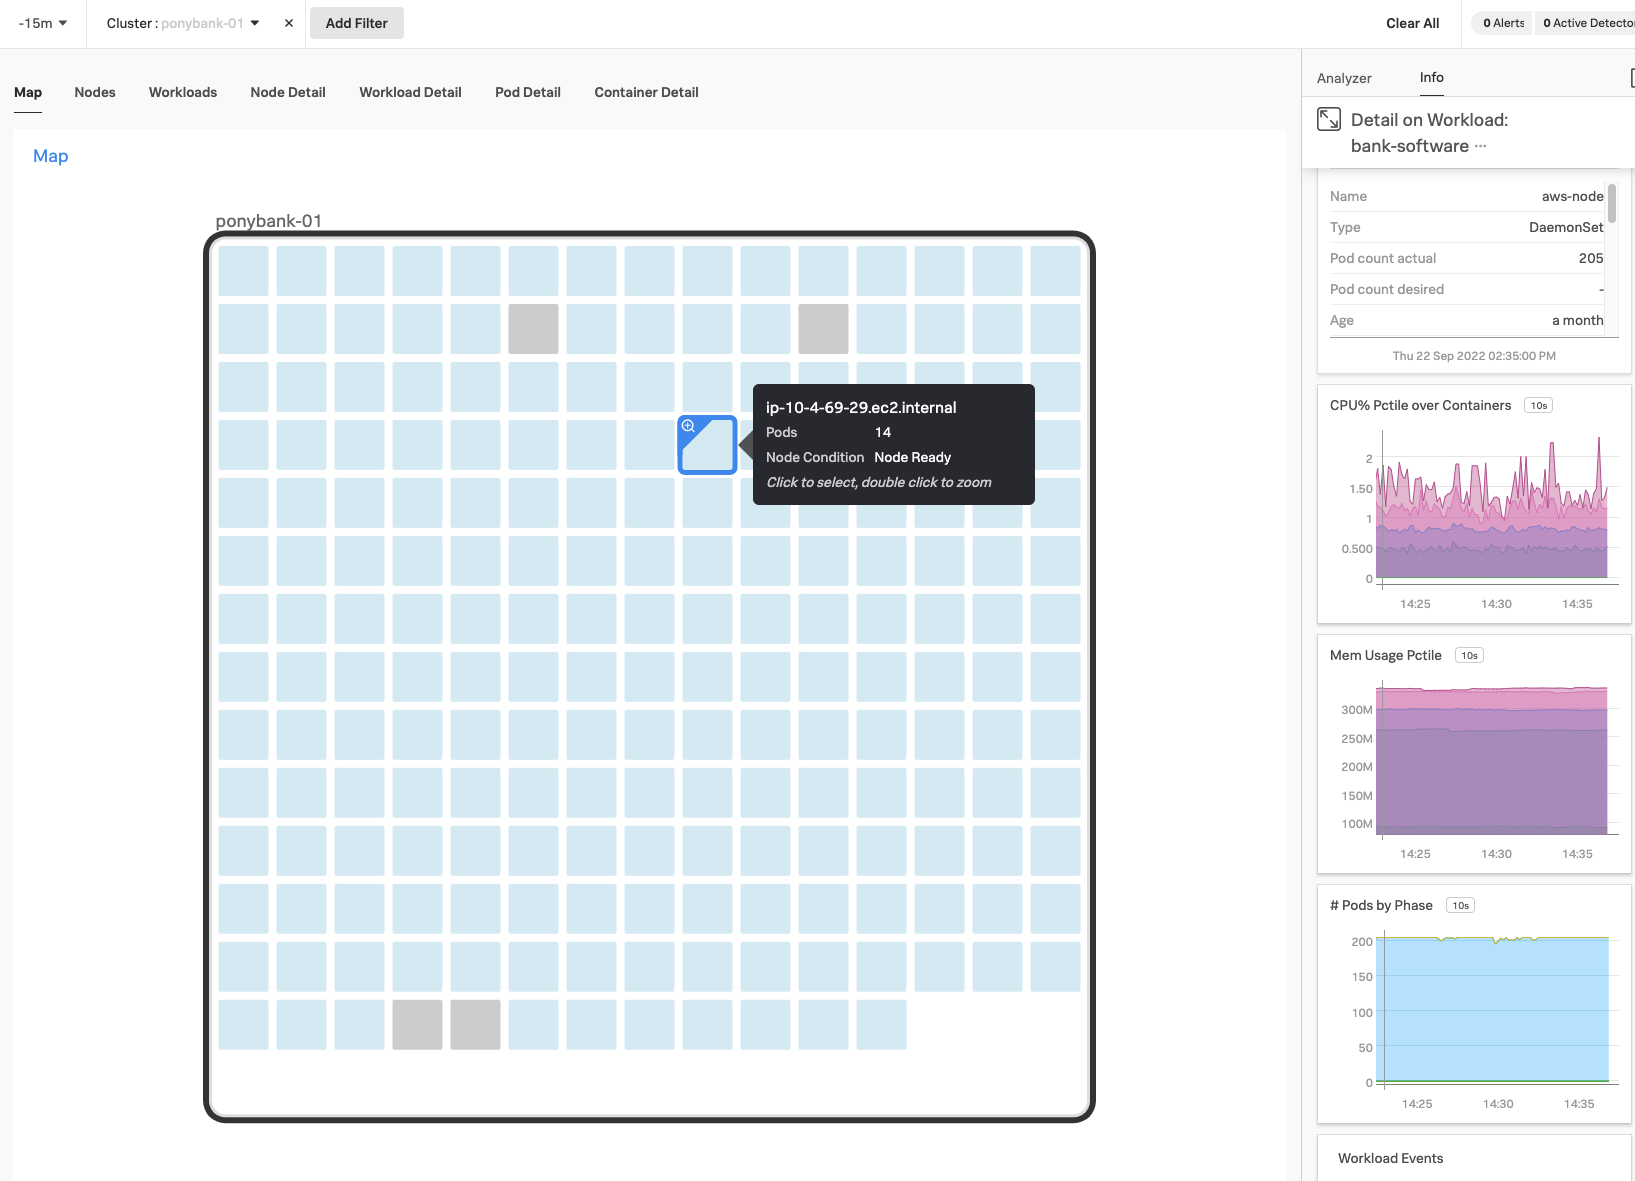
At the end of the guided setup, Kai enters the Kubernetes map of Infrastructure Monitoring and sees the cluster status. They select the nodes on the Kubernetes map, which appear as colored cubes in a grid, to learn more about the status of each element, including workloads and system metrics.
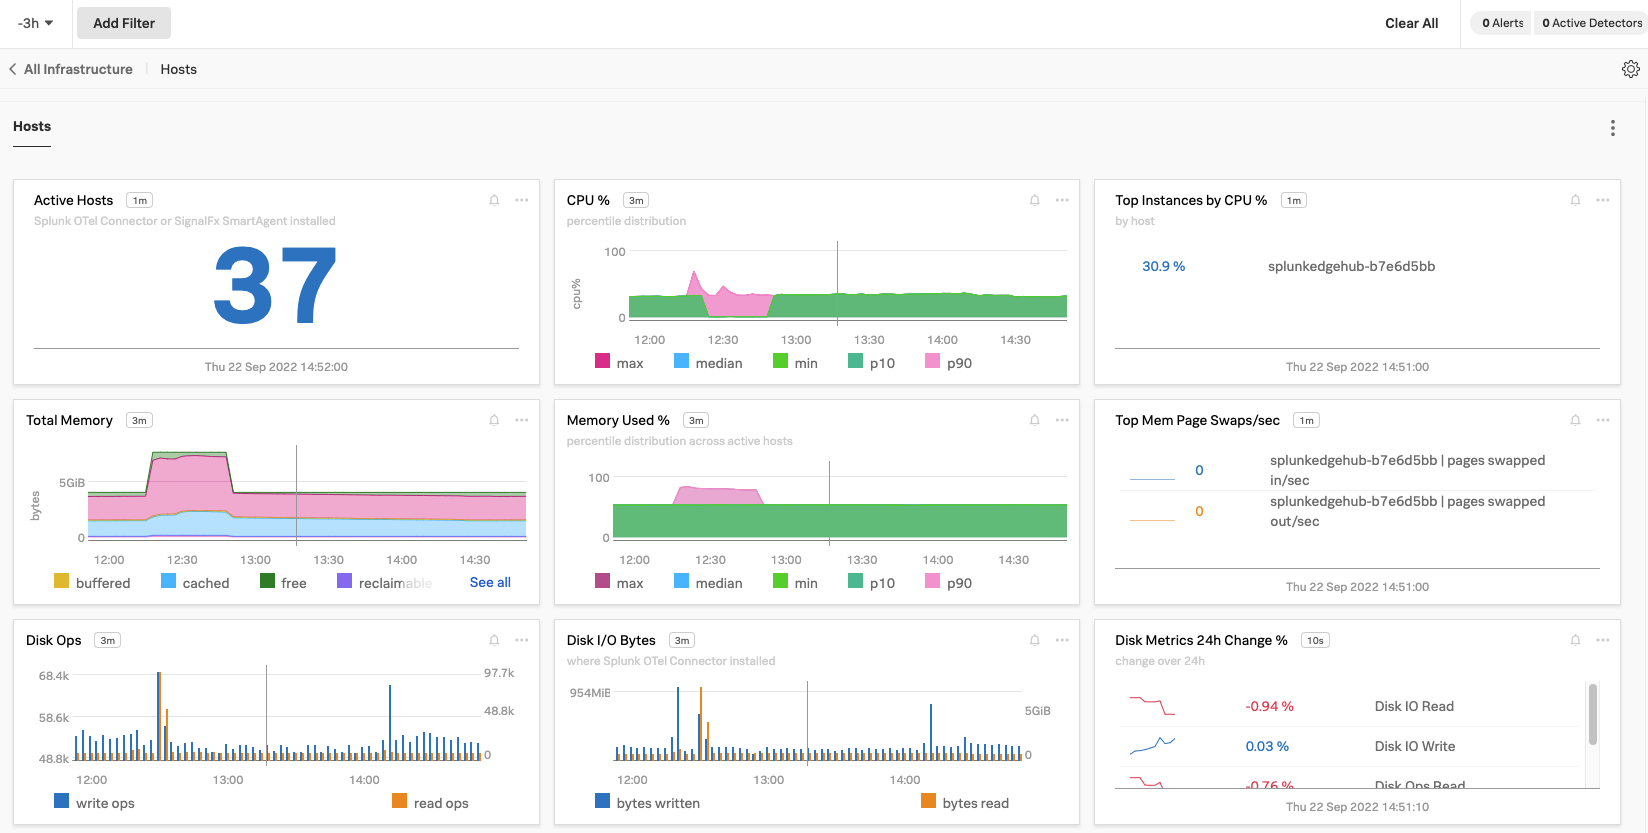
For the hosts managed by IT as Elastic Compute Cloud (EC2) instances, Kai decides to deploy the Splunk OTel Collector using the existing Puppet setup at PonyBank. They open the guided setup for Linux monitoring in Splunk Observability Cloud and select the Puppet tab. After filling out the required information, Kai only has to follow two steps:
Install the Splunk OTel Collector module from Puppet Forge.
Include a new class in the manifest file:
class { splunk_otel_collector:
splunk_access_token => '<kai_token>',
splunk_realm => 'us0',
collector_config_source => 'file:///etc/otel/collector/agent_config.yaml',
collector_config_dest => '/etc/otel/collector/agent_config.yaml',
}
Kai also uses the Linux guided setup for the few stray EC2 instances in the organization that are not managed through Puppet, following the steps from the Installer script tab. The customized installer script command downloads and runs the collector with the desired configuration.
Now, Kai can see data from each host is flowing into Infrastructure Monitoring. For each host, Kai can see metadata, system metrics, and processes, among other data points.
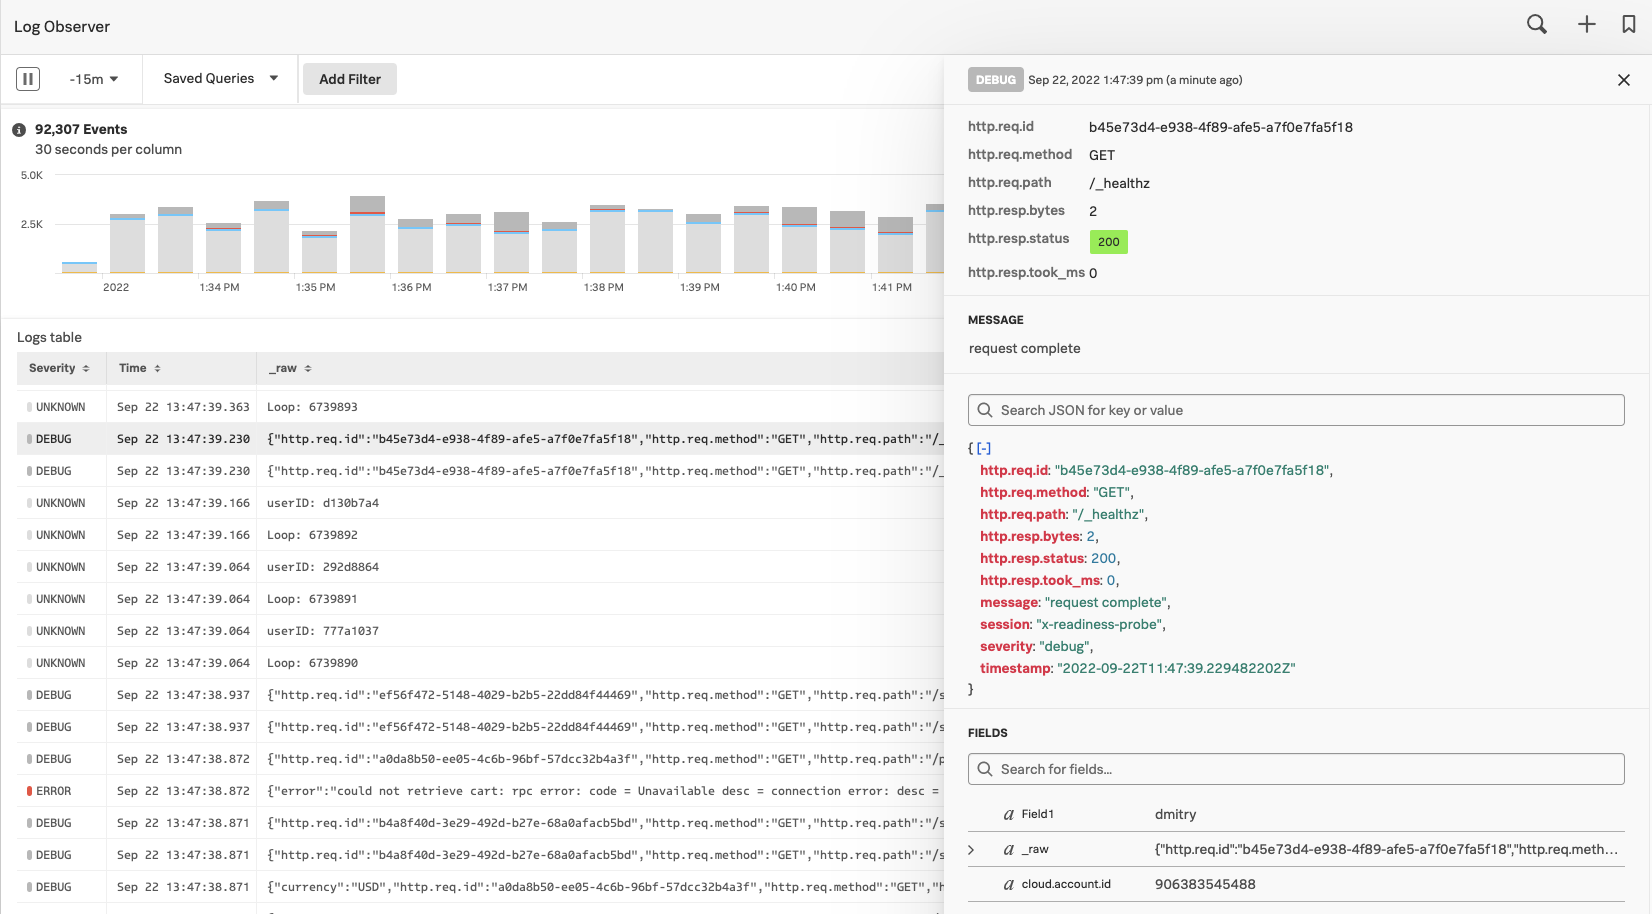
At the same time, Kai can also see logs coming from each host and node in Splunk Log Observer:
Kai’s final goal is to instrument the corporate Java service of PonyBank for Splunk APM, so that the team can analyze spans and traces in Splunk Observability Cloud, as well as use AlwaysOn Profiling to quickly identify inefficient code that’s using too much CPU or memory.
To do that, Kai selects the Java guided setup, which contains all the required instructions for enabling the Splunk Java agent after the Collector is deployed. Kai defines an environment and service name, which are essential to enable the Related Content feature between APM and Infrastructure Monitoring.
After selecting all the features and options they need, Kai obtains a YAML snippet they can add to the current Kubernetes configuration, as well as a customized runtime command.
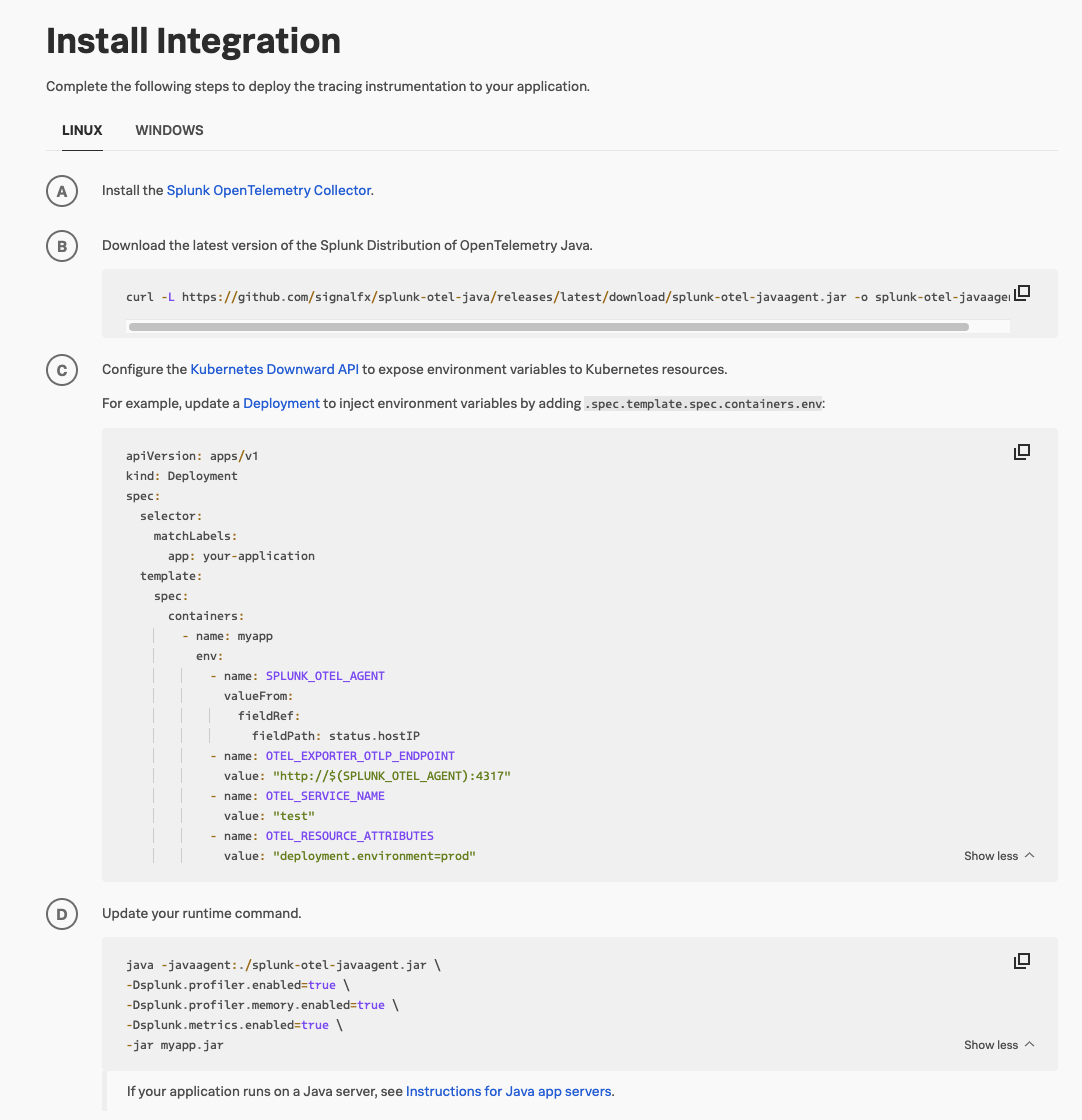
For the EC2 instances that also contain Java services, Kai uses the same guided setup, running the customized commands in the console. Instrumenting the application takes a few seconds.

Thanks to the Related Content feature, when Kai selects the node running the checkout service of the application, the service appears as a link to Splunk APM in the related content bar.
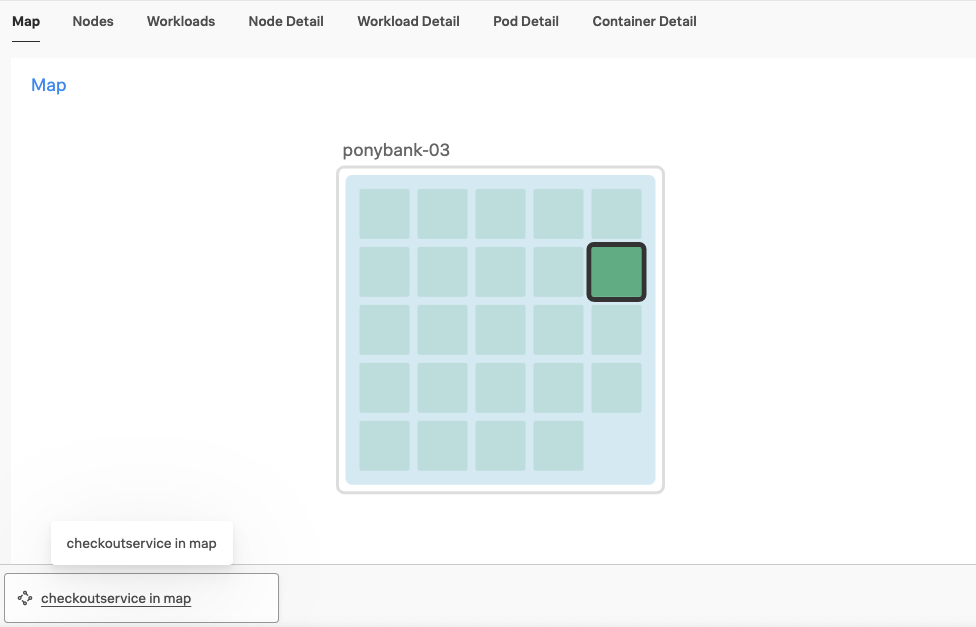
The same happens when Kai opens Splunk APM and selects the checkout service in the service map, shown in the following image. The EKS cluster for checkoutservice appears in the Related Content bar following the map. Splunk Observability Cloud suggests both links thanks to the APM and Infrastructure mapping that Splunk Observability Cloud performs using OpenTelemetry attributes and data.
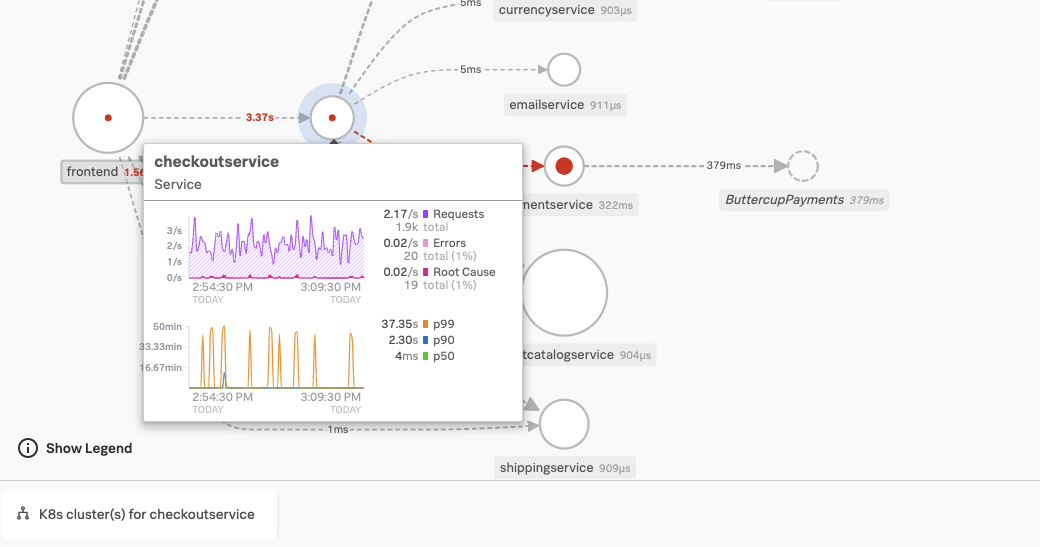
Kai used Splunk OTel Collector to instrument PonyBank’s entire cloud infrastructure, quickly obtaining configuration files and commands for each environment and situation. Through the Java instrumentation for APM, they also retrieved traces from the Java services running on the EKS clusters with related content available to access.
Learn about sending data to Splunk Observability Cloud in Get data into Splunk Observability Cloud.
To collect infrastructure metrics and logs from multiple platforms, see Get started with the Splunk Distribution of the OpenTelemetry Collector.
To instrument Java services for Splunk APM, see Instrument Java applications for Splunk Observability Cloud.
For more information on Related Content in Splunk Observability Cloud, see Configure the Collector to enable Related Content for Infra and APM.