Scenario: Kai troubleshoots an issue from the browser to the back end using Splunk Observability Cloud 🔗
Buttercup Games, a fictitious company, runs an e-commerce site to sell its products. They recently refactored their site to use a cloud-native approach with a microservices architecture and Kubernetes for the infrastructure.
Buttercup Games site reliability engineers (SREs) and service owners work together to monitor and maintain the site to be sure that people have a great experience when they visit. One of the many reasons they decided to take a cloud-native approach is because it facilitates observability. They chose Splunk Observability Cloud as their observability solution.
This scenario describes how Kai, an SRE, and Deepu, a service owner, perform the following tasks using Splunk Observability Cloud to troubleshoot and identify the root cause of a recent Buttercup Games site incident:
For a video version of this scenario, watch the Splunk Observability Cloud Demo .
Kai, the SRE on call, receives an alert showing that the number of purchases on the Buttercup Games site has dropped significantly in the past hour and the checkout completion rate is too low. Kai trusts that these are true outlier behaviors because the alert rule their team set up in Splunk Observability Cloud takes into account the time and day of week as a dynamic baseline, rather than using a static threshold.
Kai logs in to Splunk Observability Cloud on their laptop to investigate.
The first thing Kai wants to know about the alert they received is: What’s the user impact?
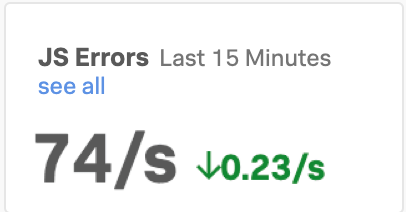
Kai opens Splunk Real User Monitoring (RUM) to look for clues about the issue based on the site’s browser-based performance. They notice two issues that might be related to the drop in purchases and the low checkout completion rate:
Kai isn’t sure if the two issues are related or whether they are the cause of the problems on the site. They decide to dig into the high latency of the /cart/checkout endpoint because the page load time and largest contentful paint for cart/checkout are also high.
Kai selects the /cart/checkout endpoint link and sees multiple errors in the Tag Spotlight view in Splunk RUM. The errors don’t seem to be related to any one tag in particular, so they select the User sessions tab to look at user sessions.
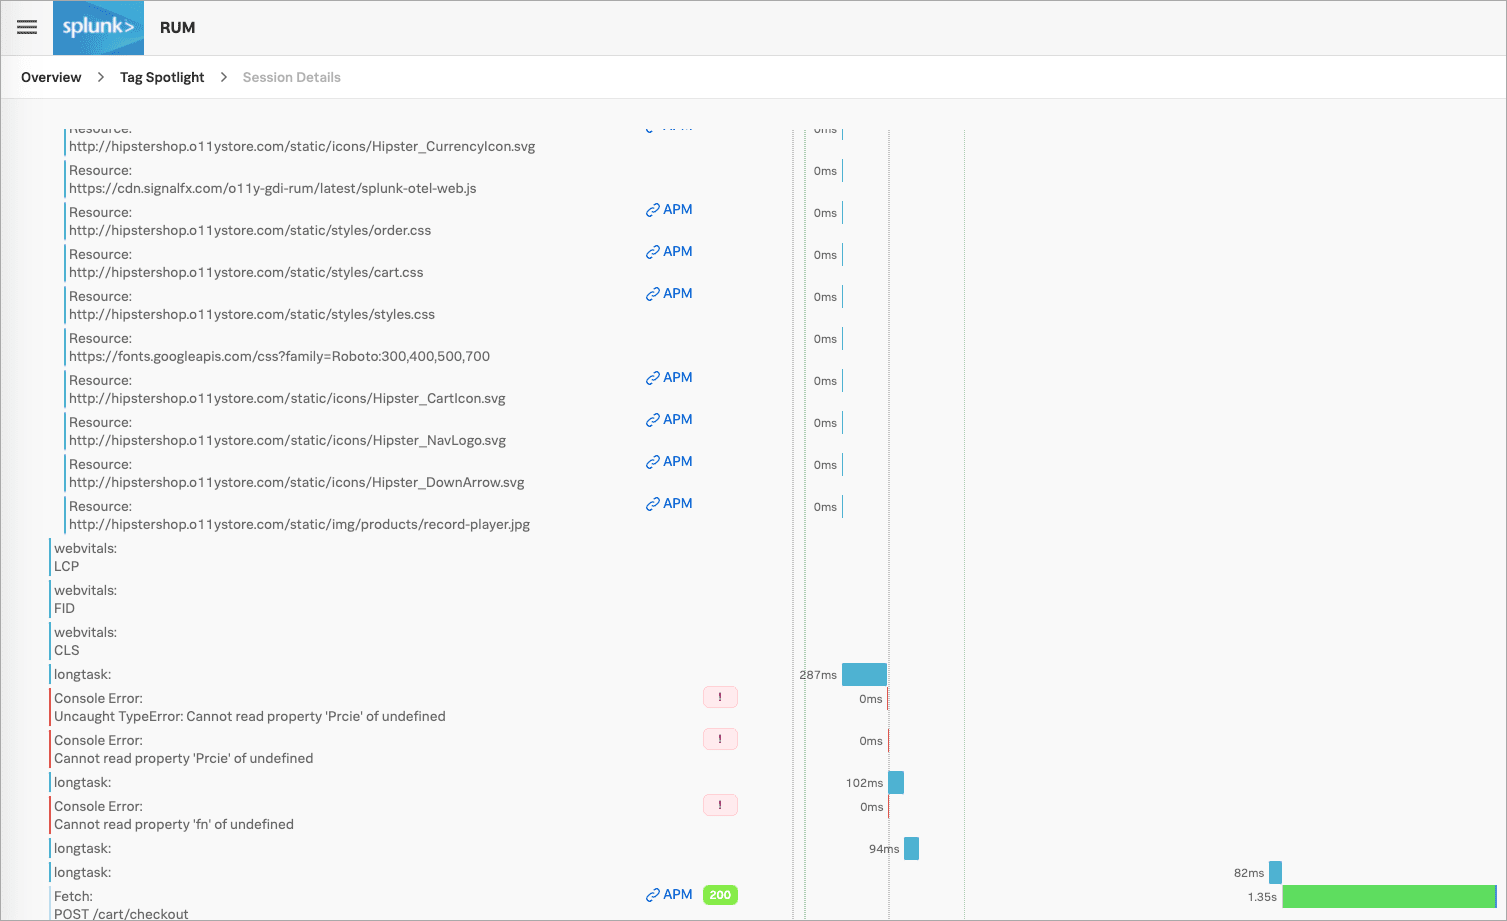
Kai sees one session that seems to be taking longer than the others. They select it to see the full trace, from the front end through to the back end, where they can see that it is taking longer to complete than normal. Based on this example data, Kai understands that the latency isn’t a front end problem and that they need to follow the trace through to the back end.
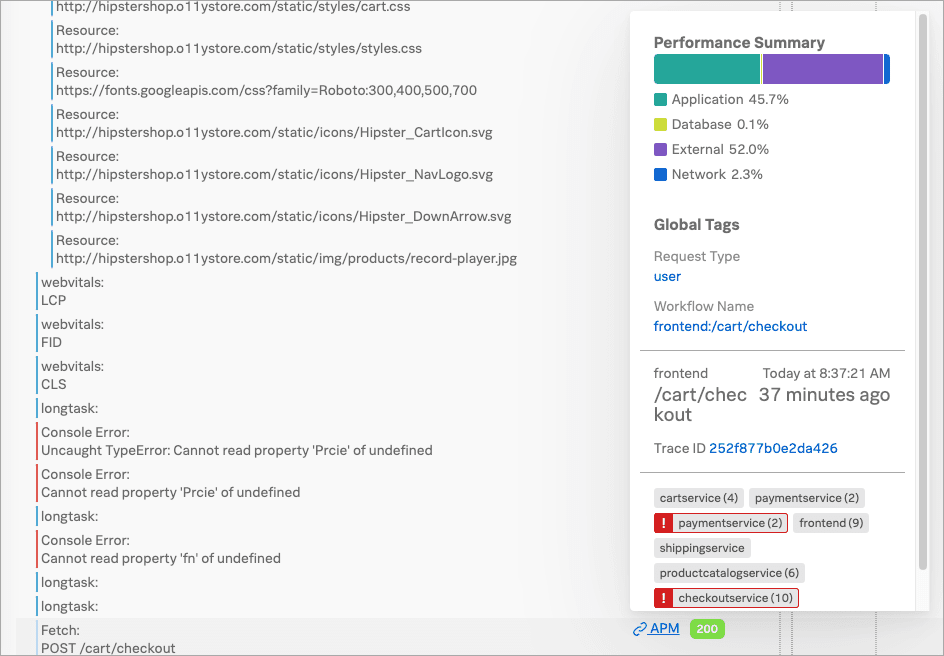
Kai selects the APM link to get a performance summary, as well as access to the session’s trace and workflow details.
Kai decides to take a look at the end-to-end transaction workflow.
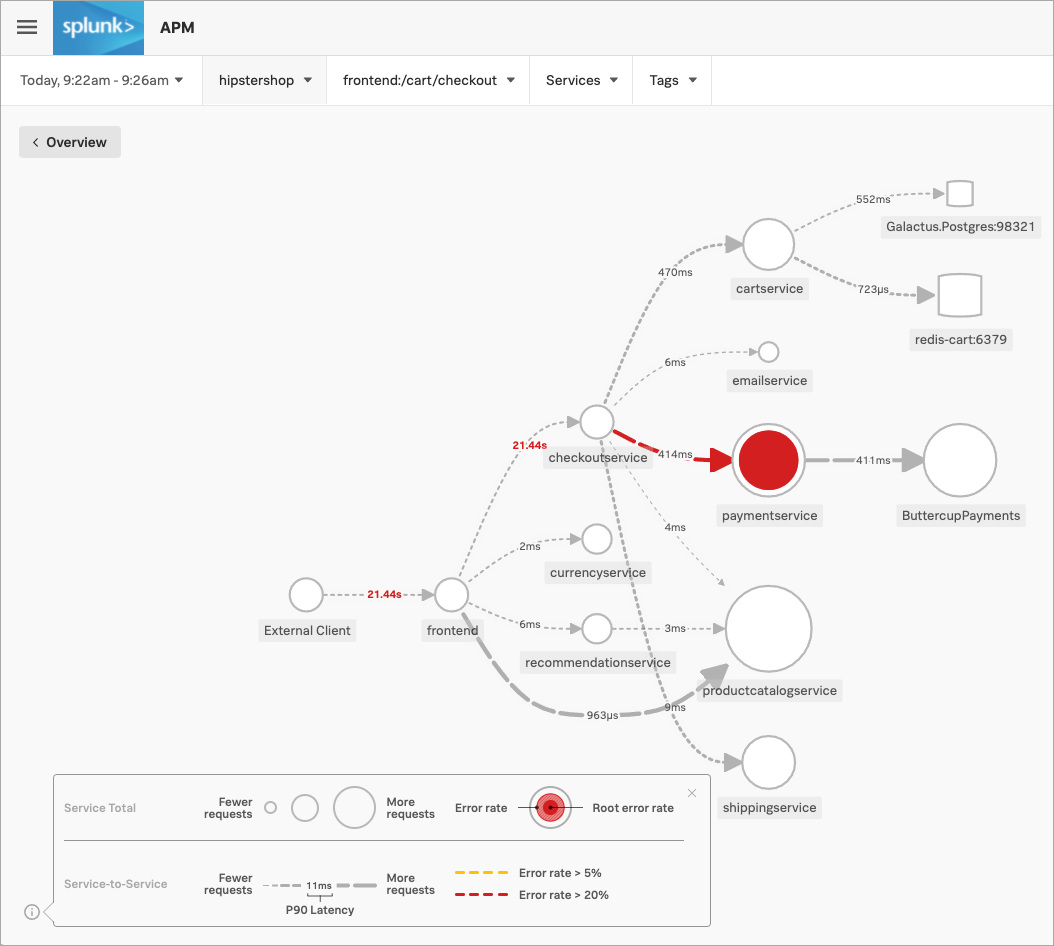
In Splunk RUM, Kai selects the frontend:/cart/checkout business workflow link to display its service map in Splunk Application Performance Monitoring (APM). A business workflow is a group of logically related traces, such as a group of traces that reflect an end-to-end transaction in your system.
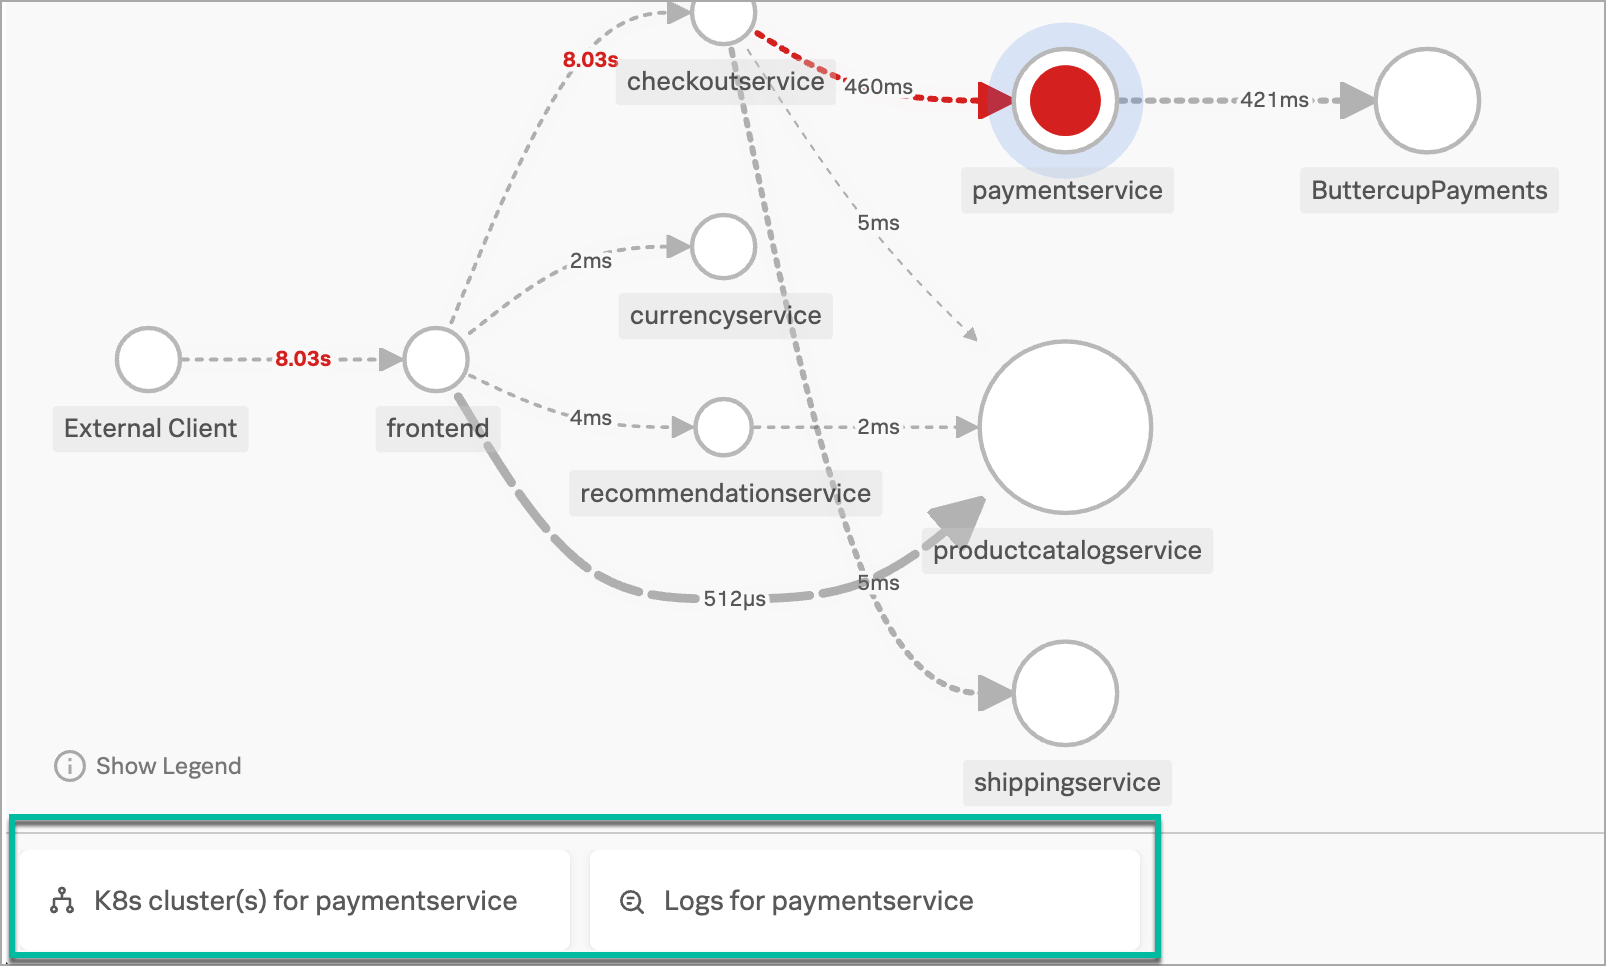
The service map shows Kai the dependency interactions among the full set of services backing the /cart/checkout action that they’re troubleshooting, including the propagation of errors from one service to another.
In particular, Kai sees that the paymentservice is having issues. Splunk APM has identified the issues as root cause errors, meaning that the paymentservice has the highest number of downstream errors that are contributing to a degraded experience for the workflow.
Kai selects the paymentservice. In addition to displaying more details about the service’s errors and latency, Splunk Observability Cloud surfaces Related Content tiles that provide access to relevant data in other areas of the application.
Kai decides to take a look at the Kubernetes cluster to see if the errors are based on an infrastructure issue.
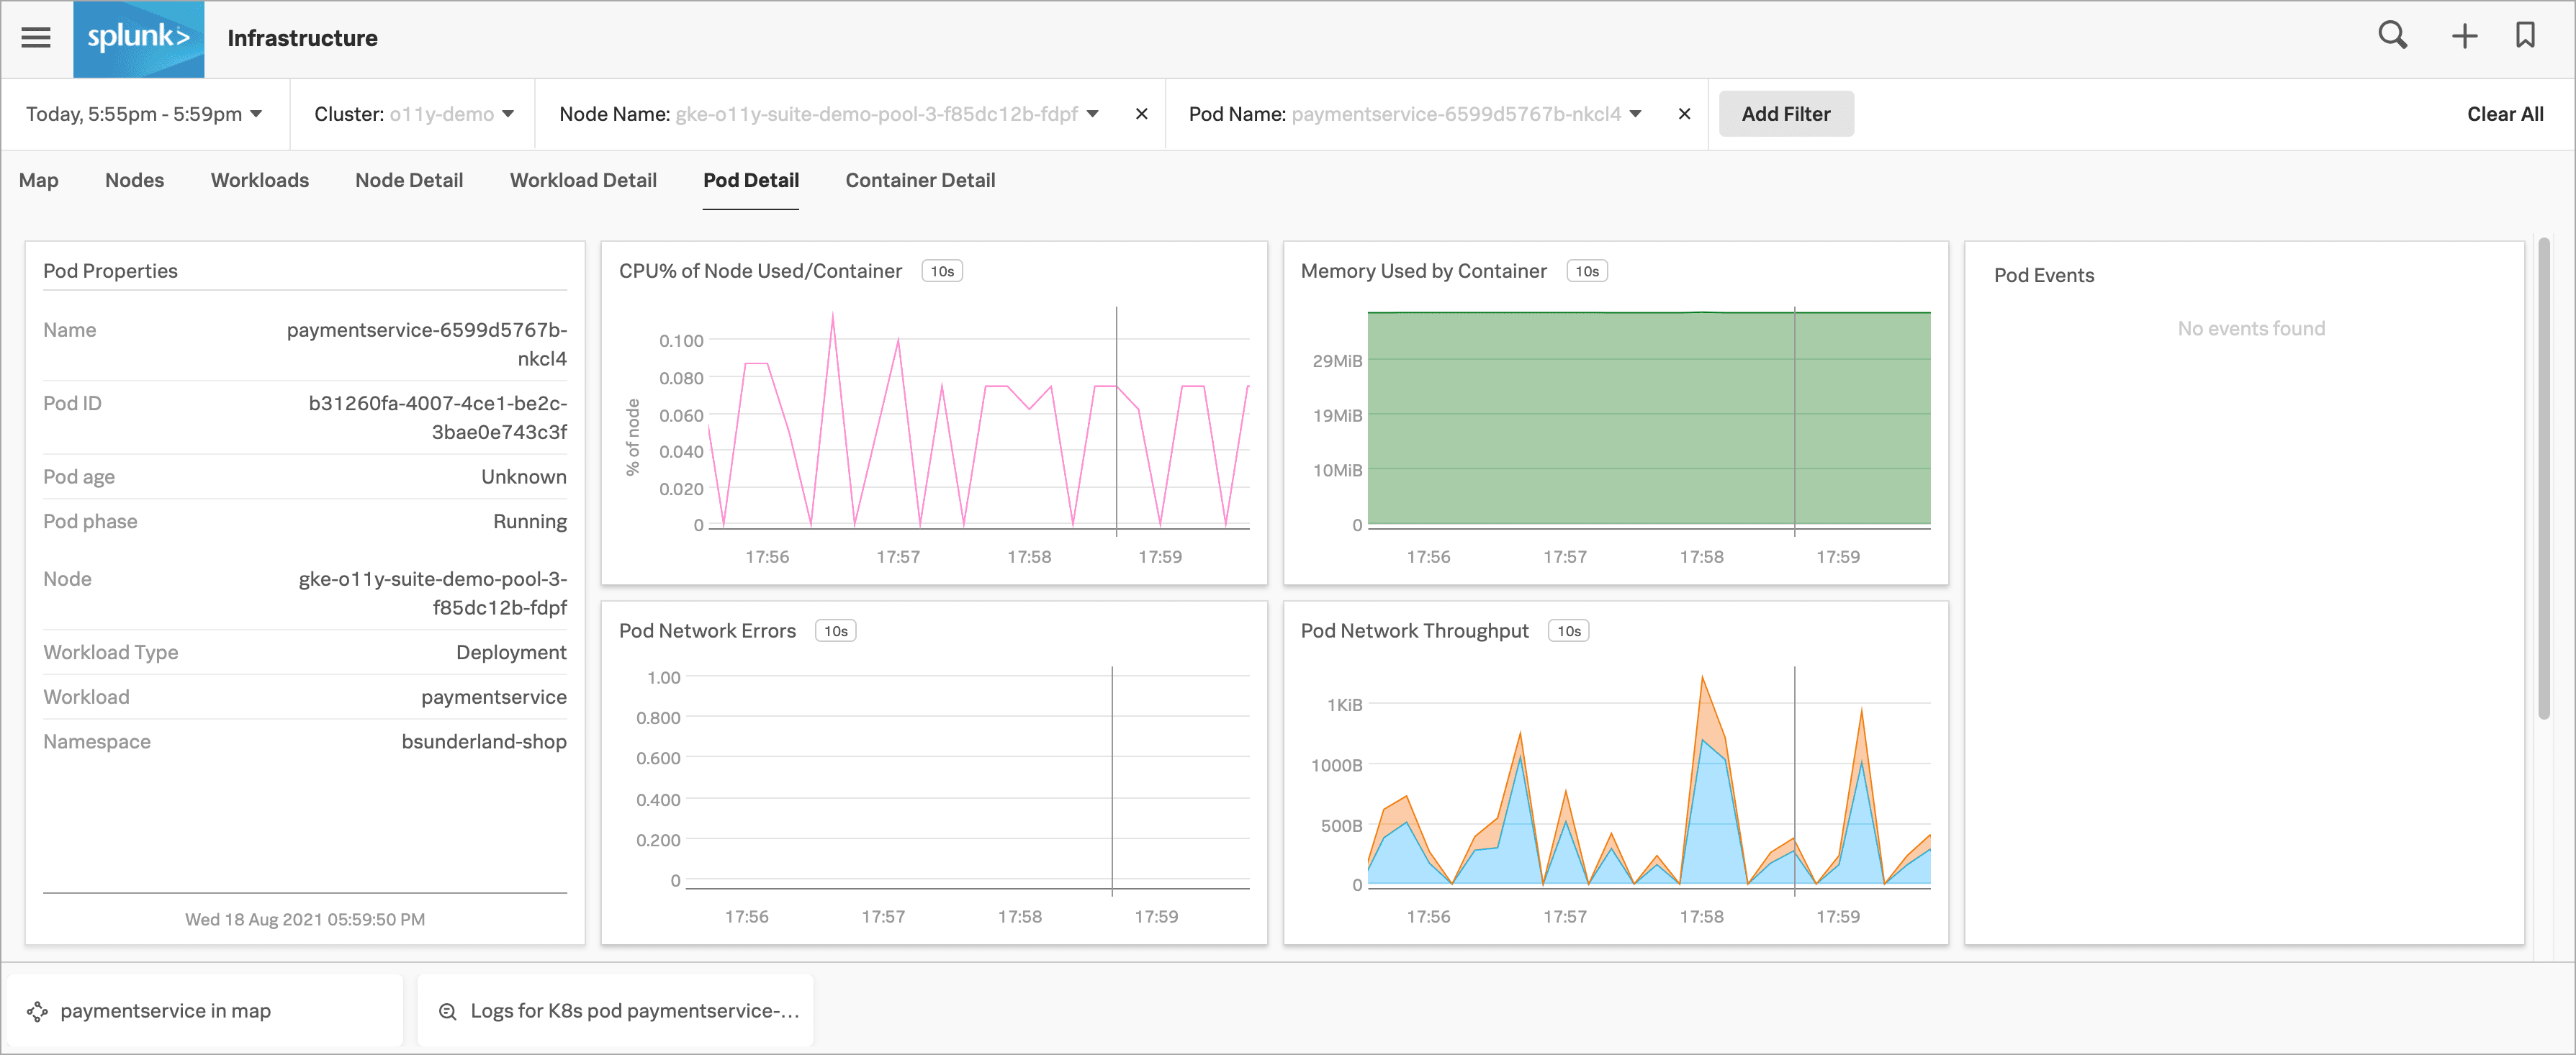
Kai selects the K8s cluster(s) for paymentservice Related Content tile in Splunk APM to display the Kubernetes navigator in Splunk Infrastructure Monitoring, where their view is automatically narrowed down to the paymentservice to preserve the context they were just looking at in Splunk APM.
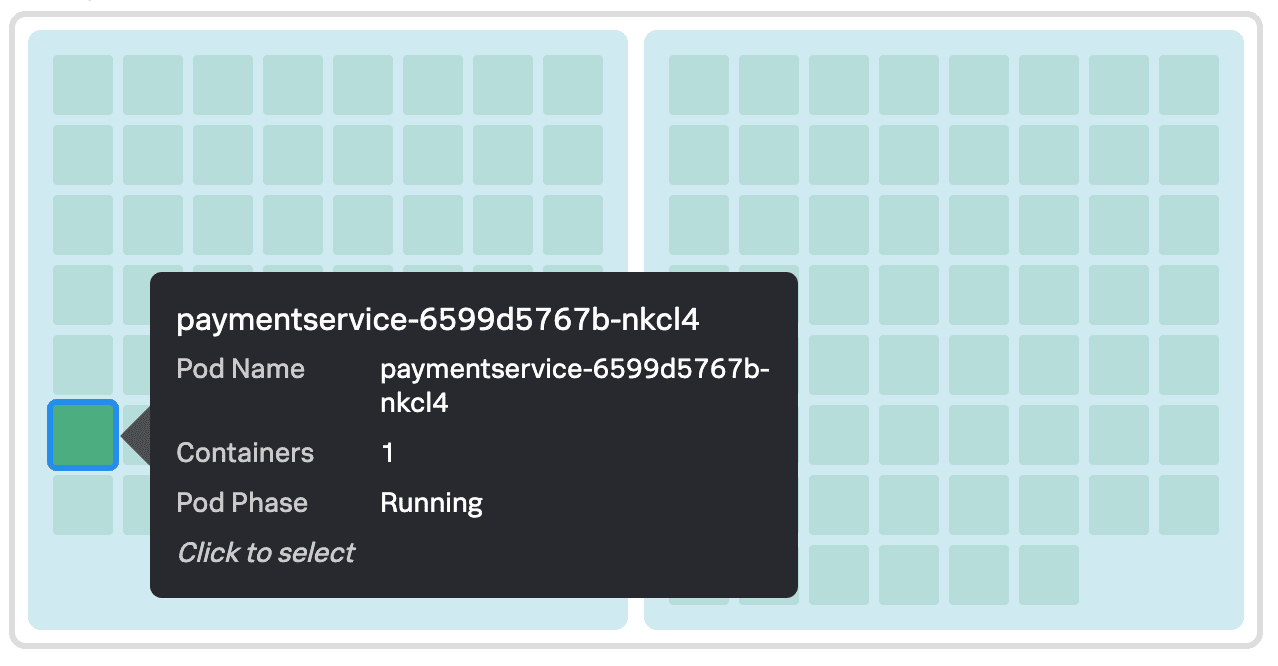
They select the paymentservice pod in the cluster map to dive deeper into the data.
Now that Kai can rule out the Kubernetes infrastructure as the source of the issue, they decide to return to their investigation in Splunk APM. Kai selects the paymentservice in map Related Content tile in their current view of Splunk Infrastructure Monitoring.
In Splunk APM, Kai selects Tag Spotlight` to look for correlations in tag values for the errors they’re seeing.
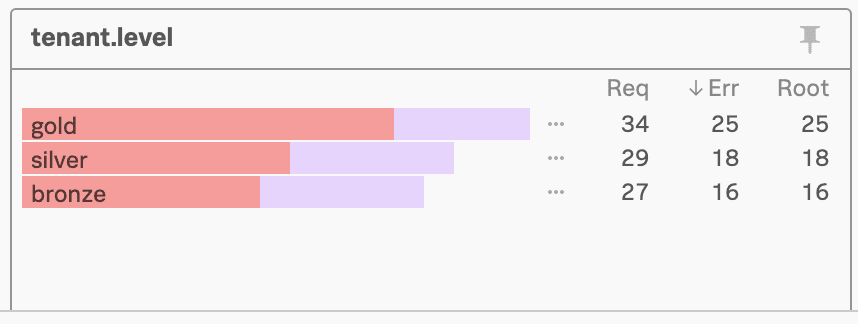
For example, when Kai looks at the tenant.level module, they see that errors are occurring for all levels, so the root cause is likely not tenant-specific.
However, when Kai looks at the version module, they see an interesting pattern: errors are happening on version v350.10 only and not on the lower v350.9 version.
This seems like a strong lead, so Kai decides to dig into the log details. They select the Logs for paymentservice Related Content tile.
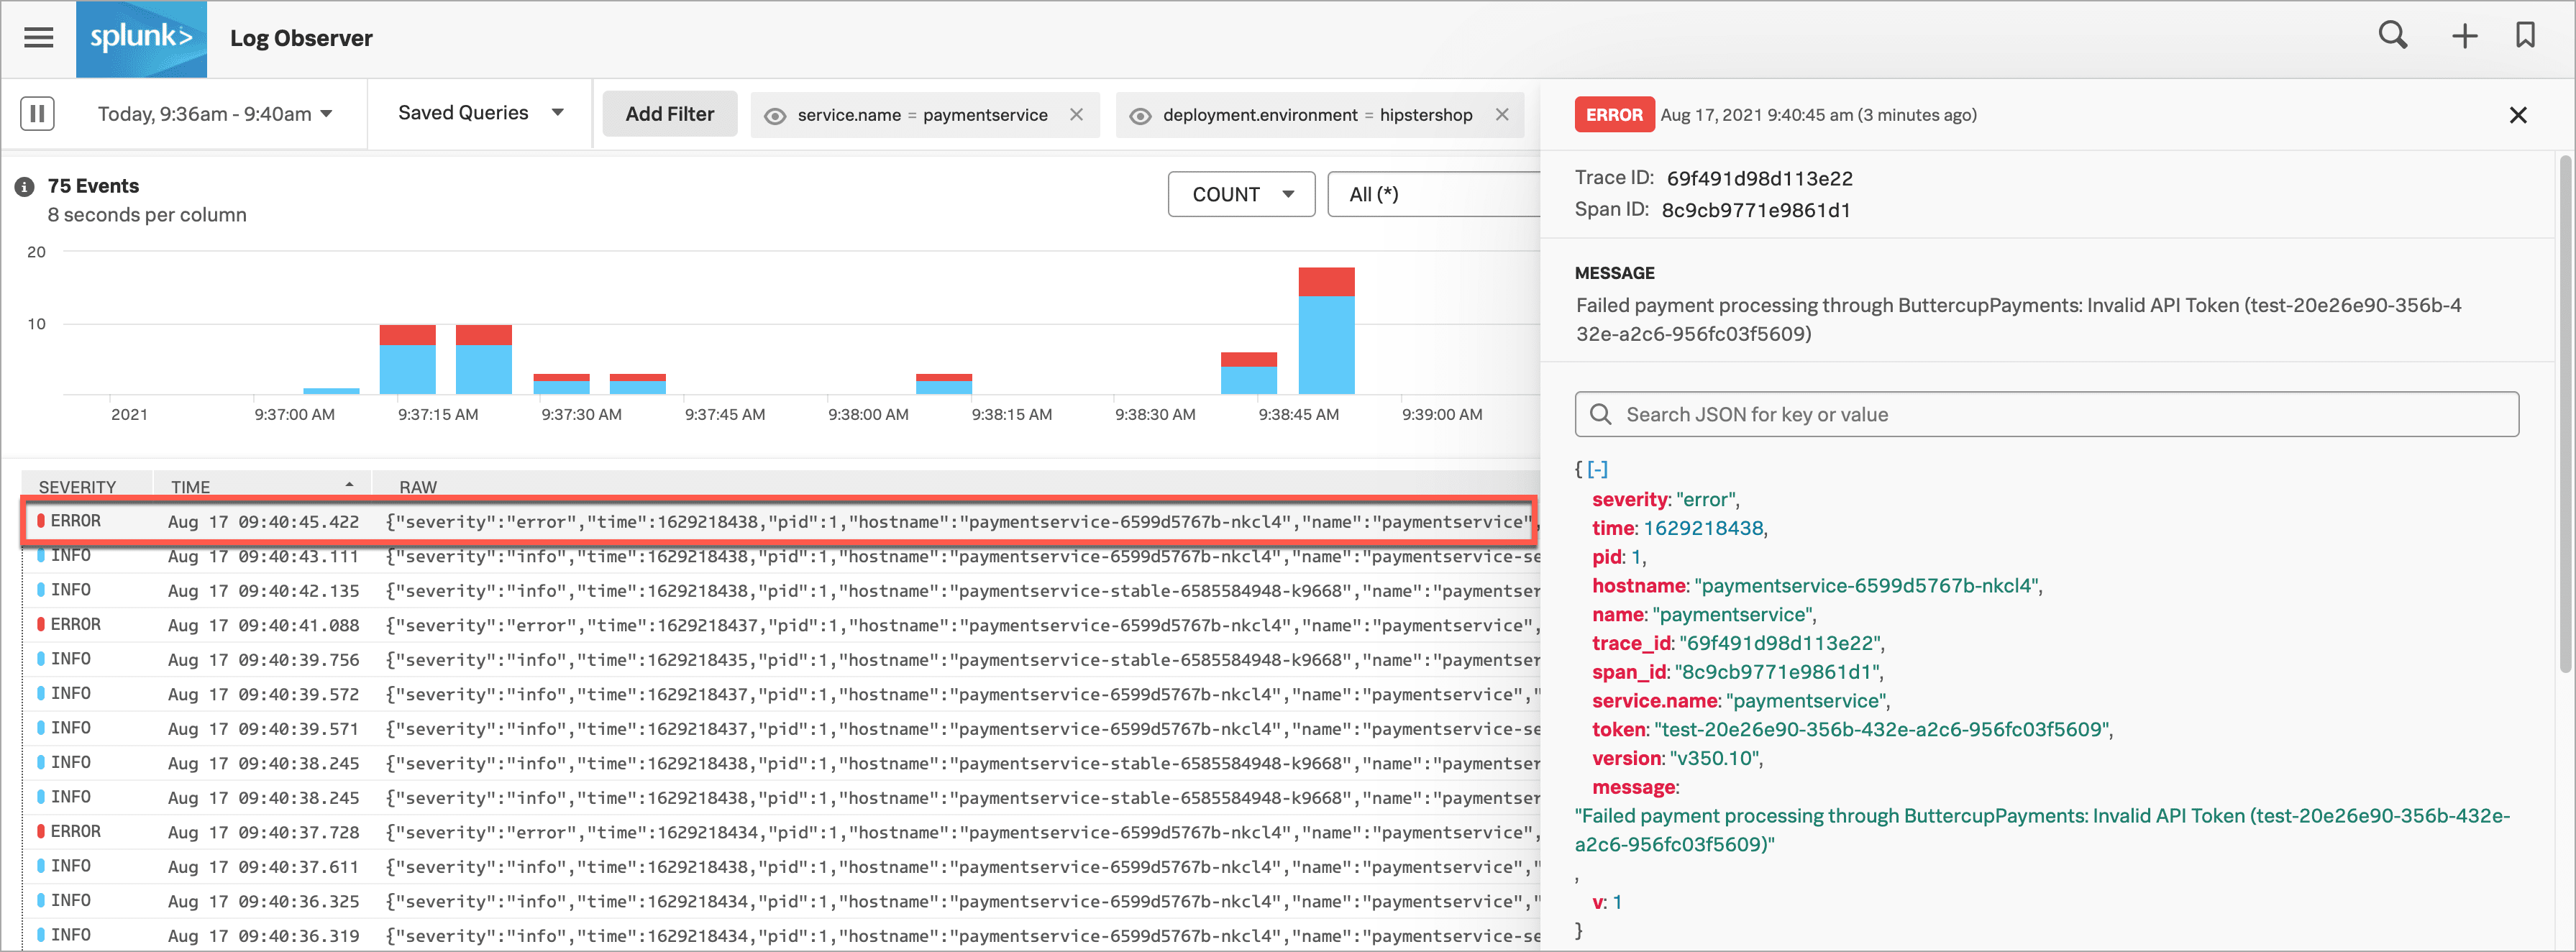
Now, in Splunk Log Observer Connect, Kai’s view is automatically narrowed to display log data coming in for the paymentservice only.
Kai sees some error logs, so they select 1 to see more details in a structured view. As Kai looks at the log details, they see this error message: “Failed payment processing through ButtercupPayments: Invalid API Token (test-20e26e90-356b-432e-a2c6-956fc03f5609)”.
In the error message, Kai sees what they think is a clear indication of the error. The API token starts with “test”. It seems that a team pushed v350.10 live with a test token that doesn’t work in production.
To check their hypothesis, Kai selects the error message and selects Add to filter to show only the logs that contain this error message.
Next, Kai changes the Group by method from severity to version.
To be sure, Kai selects the eye icon for the message filter value to temporarily exclude the filter. Now there are logs that appear for version v350.9 too, but they don’t include the error message.
This exploration convinces Kai that the test API token in v350.10 is the most likely source of the issue. Kai notifies Deepu, the paymentservice owner about their findings.
Based on Kai’s findings, Deepu, the paymentservice owner, looks at the error logs in Splunk Log Observer Connect. They agree with Kai’s assessment that the test API token is the likely cause of the problem.
Deepu decides to implement a temporary fix by reverting back to version v350.9 to try to bring the Buttercup Games site back into a known good state, while the team works on a fix to v350.10.
As one way to see if reverting to version v350.9 fixes the issue, Deepu opens the time picker in the upper left corner of Splunk Log Observer Connect and selects Live Tail. Live Tail provides Deepu with a real-time streaming view of a sample of incoming logs.
Deepu watches the Live Tail view and sure enough, the failed payment messages have stopped appearing in paymentservice logs. Reassured that the Buttercup Games site is back in a stable state, Deepu moves on to helping their team fix v350.10.
Kai was able to respond to and resolve front-end issues with the Buttercup Games website that were preventing users from completing their purchases. Kai used RUM to begin troubleshooting the errors, isolating spikes in front-end errors and back-end latency as possible causes. Digging into the /cart/checkout endpoint, Kai used the Tag Spotlight view in RUM to investigate the full trace. Based on this, Kai realized the latency wasn’t a front-end issue. Next, Kai viewed a performance summary and the end-to-end transaction workflow in APM. Looking at the service map, Kai noted that Splunk APM identified the paymentservice as the root cause of the errors. After ruling out Kubernetes issues, Kai used Tag Spotlight to look for correlations in tag values for the errors. Kai noticed that the errors were only happening on a specific version and decided to look into the log details. Using Log Observer Connect, Kai looked at the log details and noticed that the error messages for the API token started with “test”.
Consulting with Deepu, the paymentservice owner, they agreed that the test API token was the likely cause of the problem. After implementing a fix, Deepu used Log Observer Connect Long Tail reports to monitor a real-time streaming view of the incoming logs. Deepu confirmed that the payment errors were no longer occurring. As a final step, Kai saved the Splunk Log Observer Connect query as a metric in order to alert the team and help resolve similar issues faster in the future.
For details about creating detectors to issue alerts based on charts or metrics, see Create detectors to trigger alerts.
For details about setting up detectors and alerts, see Introduction to alerts and detectors in Splunk Observability Cloud.
For details about integrating alerts with notification services, like Splunk On-Call, PagerDuty, and Jira, see Send alert notifications to services using Splunk Observability Cloud.
For details about using Splunk RUM to identify and troubleshoot frontend errors, see Identify errors in browser spans.
For details about business workflows, see Correlate traces to track Business Workflows.
For details about using Related Content, see Related Content in Splunk Observability Cloud.
For details about using the Kubernetes navigator and other navigators, see Use navigators in Splunk Infrastructure Monitoring.
For details about using Tag Spotlight, see Analyze service performance with Tag Spotlight.
