Set up a browser test 🔗
Use a browser test to monitor the user experience for a single page or a multi-step user flow by running a synthetic test of the URLs you provide. Use this type of test to monitor conversion paths or any path that requires multiple steps or runs JavaScript. For an example, see Scenario: Monitor a multi-step workflow using a Browser test.
For each page checked in a browser test, Splunk Synthetic Monitoring captures an HTTP Archive (HAR) file, represented in a waterfall chart, which illustrates the performance of specific resources within the page. Browser tests also capture a set of 40+ metrics. See Waterfall chart and Browser test metrics to learn more.
Note
If the site or application you are monitoring uses allow lists or block lists for visitors or an analytics tool to measure traffic, check that it’s configured to accommodate traffic from Splunk Synthetic Monitoring. See Get your site ready to run synthetic tests for instructions.
Set up a browser test 🔗
For optimal experience, browser tests use a stable version of Google Chrome: 116.0.5845.96-1 to simulate user activity.
Follow these steps to set up a browser test:
From the landing page of Splunk Observability Cloud, navigate to Splunk Synthetic Monitoring.
Under Tests, select Create new test and then select Browser test from the drop-down list. The test creation view opens.
In the Name field, enter a name for your test.
To add steps and synthetic transactions to your browser test, select Edit steps or synthetic transactions. See Add synthetic transactions to your Browser Test to learn more.
As you build your test, you can use Try now to check that the configuration of your test is valid. Try now results are ephemeral and don’t impact persisted run metrics. See Validate your test configuration with try now.
(Optional) Add a wait time before a step executes. See Wait times.
(Optional) Enable automatic test retry in the event a test initially fails.
Save your test.
Customize your test details 🔗
Use these steps to customize your test configuration and finish creating your test:
In the Locations field, enter the locations from which you want to test the URL. You can select one or multiple locations.
In the Device Type field, use the list to select the device from which you’d like to conduct the test.
In the Frequency field, select your desired test frequency from the list.
(Optional) Use the Round Robin selector to switch between options: enabling Round Robin means your test cycles through your selected locations one at a time, while disabling Round Robin runs the test from all selected locations concurrently at your selected frequency.
If you want to receive alerts from this test, select + Create detector to set up a detector on the test. Use the dialog box to customize your detector.
Select Submit. This redirects you to the Test History page for your new test. If you’ve just created the test, allow at least one test frequency interval for your test to begin collecting synthetic data.
(Optional) Select Edit test or the three-dot Actions menu in the row for your test to edit, pause, duplicate, or delete this test.
See also 🔗
See Public locations to learn more about the locations from which you can run your test.
See Detectors and alerts to learn more about detector options.
Import a JSON file generated from Google Chrome Recorder 🔗
To simplify the test creation process, make a recording using Google Chrome Recorder. Then, import the JSON file to Splunk Synthetic Monitoring to automatically import the steps in the workflow instead of adding each individual interaction you want to track. Recordings are especially helpful for complex user flows, or tests that have a large number of steps.
Create a Google Chrome Recorder JSON file 🔗
For steps on how to make a Google Chrome recording, see Record, replay, and measure user flows in the Chrome Developer user guide in Google documentation.
Requirements
In Google Chrome Recorder, select either CSS or XPATH for Selector type to record.
Browser tests run in one Browser tab only. Your recording can’t span multiple tabs.
Import a Google Chrome Recorder JSON file 🔗
Note
Recordings from Google Chrome Recorder include the specific viewport size of the browser window used in the recording. When you import a recording, Splunk RUM doesn’t import the viewport size into the browser test. Therefore, you must check that the test’s device setting matches the viewport size used by the recorded browser window.
Follow these steps to import a JSON file from Google Chrome Recorder to a new or existing browser test.
In Splunk Synthetic Monitoring, select Edit on an existing Browser test to open the test configuration page, or create a new test.
Select Import.
Upload the Google Chrome Recorder JSON file.
If a step is not supported, edit or delete that step in the test configuration page.
(Optional) Add a name to each step.
Save your changes.
Troubleshoot unsupported steps 🔗
If your recording contains unsupported steps, you need to edit the step to reformat it into one of the supported browser step types. The following table shows how Google Chrome Recorder step names and code snippets map to their counterparts in browser tests. These examples use Buttercup Games, a fictitious gaming company.
{
 // Google Chrome Recorder
  "type": "navigate",
  "url": "www.buttercupgames.com",
  "assertedEvents": [
     {
        "type": "navigation",
        "url": "www.buttercupgames.com",
        "title": "Buttercup Games"
     }
  ]
  }
{
// Splunk Synthetic Monitoring code snippet
"name": "Go to URL",
"type": "go_to_url",
"url": "www.buttercupgames.com",
"wait_for_nav": true
}
{
// Google Chrome Recorder
   "type": "click",
   "target": "main",
   "selectors": [
      [
         "div:nth-of-type(2) > div:nth-of-type(2) a > div"
      ],
      [
         "xpath//html/body/main/div/div/div[2]/div[2]/div/a/div"
      ]
   ],
   "offsetY": 211,
   "offsetX": 164,
   "assertedEvents": [
      {
         "type": "navigation",
         "url": "www.buttercupgames.com/product/example",
         "title": "Buttercup Games"
      }
   ]
}
{
 // Splunk Synthetic Monitoring code snippet

    "name": "",
    "type": "click_element",
    "selector_type": "css",
    "selector": "div:nth-of-type(2) > div:nth-of-type(2) a > div",
    "wait_for_nav": true
 }
{
 // Google Chrome Recorder
 "type": "click",
  "target": "main",
  "selectors": [
     [
        "div:nth-of-type(2) > div:nth-of-type(2) a > div"
     ],
     [
        "xpath//html/body/main/div/div/div[2]/div[2]/div/a/div"
     ]
  ],
  "offsetY": 211,
  "offsetX": 164,
  "assertedEvents": []

  }
{
// Splunk Synthetic Monitoring code snippet

   "name": "",
   "type": "click_element",
   "selector_type": "css",
   "selector": "div:nth-of-type(2) > div:nth-of-type(2) a > div",
   "wait_for_nav": false
}
{
 // Google Chrome Recorder
     "type": "change",
     "value": "5",
     "selectors": [
        [
           "#quantity"
        ],
        [
           "xpath///*[@id=\"quantity\"]"
        ]
     ],
     "target": "main"
     }
{
// Splunk Synthetic Monitoring code snippet
      "name": "",
      "type": "enter_value",
      "selector_type": "id",
      "selector": "quantity",
      "option_selector_type": "index",
      "option_selector": "5",
      "wait_for_nav": false
      }
{
// Google Chrome Recorder
      "type": "waitForElement",
      "selectors": [
         [
            "body",
            "#homepage_example",
            ".css-4t2fjl",
            ".eanm77i0"
         ]
      ]
      }
{
// Splunk Synthetic Monitoring code snippet
      "name": "",
      "type": "assert_element_present",
      "wait_for_nav": false,
      "selector_type": "css",
      "selector": "body,#homepage_example, .css-4t2fjl, .eanm77i0"
   }
{
// Google Chrome Recorder
   "type": "waitForElement",
   "selectors": [
      [
         "body",
         "#homepage_product_brand-example",
         ".css-4t2fjl",
         ".eanm77i0"
      ]
   ],
   "visible": false
}
{
// Splunk Synthetic Monitoring code snippet
      "name": "",
      "type": "assert_element_not_present",
      "wait_for_nav": false,
      "selector_type": "css",
      "selector": "body,#homepage_product_brand-example"
      }
{
// Google Chrome Recorder
   "type": "customStep",
   "timeout": 5000,
   "target": "main",
   "name": "customParam",
   "parameters": {}
}
{
// Splunk Synthetic Monitoring code snippet
   "name": "Unsupported step customStep",
   "type": "run_javascript",
   "value": "",
   "wait_for_nav": false
}
View your browser test 🔗
Now that you created and saved a test, check whether it’s collecting data as expected:
From the Tests list, select the three-dot Actions menu and select Play arrow icon to manually trigger a live run of the test, or wait for at least one duration of the test frequency you set so that the test has time to run and collect data.
Select the test you’re interested in to open the Test history view, where you can view visualizations of recent test results and metrics.
See Interpret Browser test results to learn more about browser test results.
Edit your browser test 🔗
To edit your browser test, do the following:
Select the row for the test you want to edit in the Tests list to open the Test history view.
Select Edit test to edit your test configuration.
If you change the name of your test or the name of a synthetic transaction, it may take up to 20 minutes for the updated name to appear in your charts and detectors.
Advanced settings for browser tests 🔗
There are many reasons why you might want to configure advanced settings for your synthetics tests. Here are a few:
Accessing a site with a modal that appears randomly and interrupts the flow of the test. For example, a marketing modal might prompt a user to sign up for a rewards program. To circumvent this issue you can set a cookie to stop the popup modal from appearing and interfering with your test.
Running a test on a site that requires users to log in to access the site.
Specifying the type of device on which you want to run your test by setting the
User-Agentheader on requests.Testing out a CDN. For example, you might want to load the HTML page in the browser, but rewrite the hosts for some or all requests to a new host.
Filtering out requests from analytics on the back end by sending a specific header in the requests.
Running a test on a pre-production site that has a self-signed certificate.
Collect interactive metrics 🔗
Interactive metrics are collected by default for each page in the test flow, but this can result in longer run durations depending on how long it takes for the page to become fully interactive. You can turn off interactive metrics in advanced settings to speed up run durations and see results faster. If you turn off interactive metrics then the following metrics might be missing from your test:
First CPU idle: Time until the page is minimally interactive and responds to user input.
Time to interactive: This measures the time until the page responds to user input quickly. It is used to identify when the page is actually usable, not just when the page load looks complete.
Lighthouse score: A weighted aggregation of several browser test metric values calculated using v10 of the Lighthouse desktop scoring algorithm. See https://developer.chrome.com/docs/lighthouse/performance/performance-scoring#lighthouse_10 in the Google developer documentation to learn more about Lighthouse scoring.
Auto-retry 🔗
Run a test again automatically if it fails without any user intervention. It’s a best practice to turn on auto-retry to reduce unnecessary failures from temporary interruptions like network issues, timeouts, or intermittent issues on your site. Auto-retry runs do not impact subscription usage, only the completed run result counts towards your subscription usage. Auto-retry requires at least runner version 0.9.29.
TLS/SSL validation 🔗
When activated, this feature is used to enforce the validation of expired, invalid hostname, or untrusted issuer on TLS/SSL certificates.
Note
When testing pre-production environments that have self-signed or invalid certificates, it’s best to leave TLS/SSL validation feature deactivated.
Authentication 🔗
Add credentials to authenticate with sites that require additional security protocols, for example from within a corporate network. To use Authentication, a username and password need to be provided. The username can be entered as plain text or be defined by a global variable, but the password must be defined using a global variable. It is recommended to use a concealed global variable for your password to create an additional layer of security for your credentials. For more, see What happens when you conceal a global variable?.
When executing the browser test, the Chrome browser is configured with the credentials defined in the test configuration. Authentication is not integrated at the OS level, and no authentication processing happens in the runner itself. Credentials are passed directly to Chrome for handling.
At this time, Chrome supports the following authentication protocols:
Basic Authentication
NTLM
Kerberos (with limitations)
Digest
Chrome supports Kerberos authentication only when it can infer the correct Kerberos service principal name (SPN) based on standard conventions. This support doesn’t include Kerberos Credentials Delegation (Forwardable Tickets) .
Custom headers 🔗
Specify custom headers to send with each request. For example, you can add a header in your request to filter out data from back-end analytics. To add a custom header, a name and value are required. You may optionally provide a domain to scope the header to. If a domain is specified, only requests sent to that domain will include the header. Otherwise the header will be included in requests to all domains.
You can also use headers to change the user agent. The default user agent is the given one for the selected device, which updates whenever the Chrome version changes for synthetic runners. To customize the user agent header for all domains, turn off the “Use device default” toggle next to the user agent field and then enter the new value. To change the user agent for specific domains, add a custom header and provide the domain you wish to apply that user agent to. If a domain is not specified, the top-level user agent setting takes precedence.
Custom headers can be used to set cookies, but we recommend using the Cookies settings instead outlined in the section below.
Host overrides 🔗
Add host override rules to reroute requests from one host to another. For example, you can create a host override to test an existing production site against page resources loaded from a development site or from a specific CDN edge node.
You can also indicate whether to retain the original HOST header by activating Keep host headers. If activated, the original request’s headers remain intact (recommended). If deactivated, a change in the HOST header to the new host might occur, potentially leading to an internal direct (307). Keep host headers is activated by default.
Note
Host overrides apply only to the exact hostname you specify. They don’t automatically apply to subdomains. In other words, host overrides don’t support wildcards. If you need to override any subdomains, you must create a separate host override for each subdomain’s fully qualified domain name (FQDN). For example, if you create a host override for domainA.com to domainB.com, requests to domainA.com are redirected to domainB.com, but requests to mail.domainA.com are not automatically redirected to mail.domainB.com. You must explicitly create a separate host override for mail.domainA.com.
Wait times 🔗
Optimize your test coverage by adding custom wait times to capture longer page loads and improve the accuracy of run results. Applications with long load times can cause a browser test to fail. If you know that there are certain steps in a workflow that take longer than 10 seconds, add a custom wait time to your browser test.
Wait times are available with browser tests only.
The maximum custom wait time for each test is 200 seconds.
Follow these steps to configure custom wait times for your browser tests:
In Splunk Synthetic Monitoring, select Edit on the browser test to open the configuration panel.
Select New step > Wait, from the step type drop down.
Add a name and the wait time in ms.
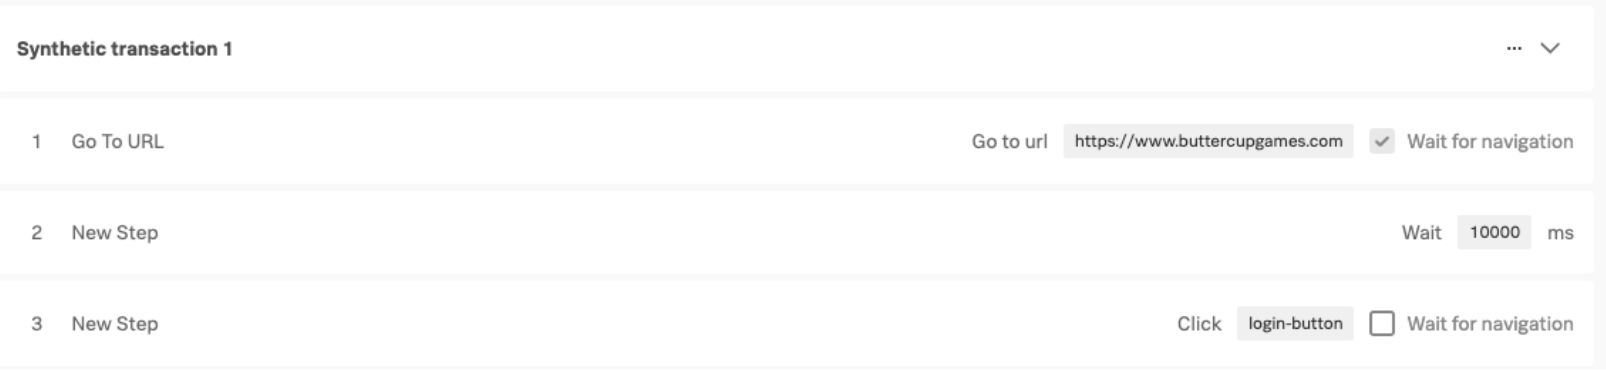
When you finish instrumenting your test, save the workflow: Return to test > Save.
The following image shows how to configure a test to go to a URL, wait for 10 seconds, then log in.
Limits and defaults for configurable wait times 🔗
Here are the limits for each type of wait time. The maximum limit for a run is 30 minutes, after which it times out.
Description |
Limit |
|---|---|
Assert steps |
90 seconds |
Wait for navigation |
20 seconds |
Description |
Default |
|---|---|
Wait time for assert |
10 seconds |
Wait for navigation |
2 seconds |
Chrome flags 🔗
Google Chrome flags are a helpful tool for troubleshooting. Activate browser features that are not available by default to test custom browser configurations and specialized use cases, like a proxy server.
For more, see What are Chrome flags? in the Google Chrome Developer guide.
Note: Global variables are incompatible with Chrome flags.
These are the flags available:
Chrome flag |
Description |
|---|---|
|
Requests are made using using |
|
Deactivates QUIC, which also deactivates HTTP3. |
|
Deactivate enforcement of same origin policy. |
|
Treat given insecure origin as secure. Multiple origins can be supplied in a comma-separated list. |
|
Proxy bypass list for any specified proxy for the given semi-colon-separated list of hosts. This flag must be used with |
|
Uses a specified proxy server to override default settings. |
|
Don’t use a proxy server, always make direct connections. This flag can be used to override any other proxy server flags that you may have set up in a private location. |
Excluded files 🔗
You can configure your browser test to ignore specific file types or patterns so that it skips all HTTP requests that match those file types or patterns.
Exclusion rules are useful to:
Prevent false alerts from test analytics.
Test the performance of a page with or without specific resources loading.
Prevent specific third-party services from loading, such as random pop-ups from third-party services.
Ignore files that are known to cause performance problems.
To create an exclusion rule:
On the browser test’s configuration page, select the Advanced toggle.
Scroll down to the Custom content section.
Select Add excluded file.
Select a value in File type:

To exclude all files of a common predefined type, select that type.
To exclude all file types except those that match the value you specify, select All Except and specify a value or regular expression.
To use regular expressions, select Custom and specify a value or regular expression. For example:
To exclude a specific domain, including all of its subdomains, enter
domainname\.comTo exclude only the subdomains of a specific domain, but not the domain itself, enter
.+\.domainname\.comTo exclude a JavaScript app, enter
domainname\.com/appname\.jsTo exclude entire directories, enter
domainname\.com/directoryname\/.+
Note
All Except inclusions take precedence over other exclusions. The order in which you specify exclusions doesn’t matter except when you’re using a combination of All Except and Custom.
Custom properties 🔗
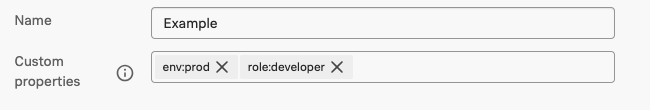
Add custom properties in the test creation page in advanced settings. Use key-value pairs to create custom properties to filter and group dashboards, charts, and create alerts. A list of suggested custom properties is available for each test based on the tags associated with your test. For example: env:test, role:developer, product:rum. When you have multiple key-value pairs the logic is AND among the results. So in this case, the results show all tests for the RUM product with a developer role in the environment test.
Custom properties are single valued and don’t support multiple values, like region:eu, us. For each test, you can only use one and unique key. For example, you can have env1:test and env:test in the same test, but you can’t have env:test, and env:prod.
Key requirements:
Keys must start with an uppercase or lowercase letter. Keys can’t start with special characters or numbers.
The remainder of the key can contain letters, numbers, underscores and hyphens.
Keys can’t be named
test_idortest.Key size can’t exceed 128 characters.
See, Custom properties.
Example 🔗
For an example, see Scenario: Monitor a multi-step workflow using a Browser test.