Detectors and alerts 🔗
In Splunk Observability Cloud, detectors monitor your tests and metrics for anomalies and generate alerts when problems arise. You can customize the alerting threshold, severity, notification method, recipients, and more.
To learn more about advanced alerts and detectors in Splunk Observability Cloud, see Introduction to alerts and detectors in Splunk Observability Cloud. Read on to learn about creating static threshold detectors specific to Synthetics.
Types of detectors in Synthetics 🔗
In Synthetics, there are detectors to alert on metrics at the test level, at the page level, or at the synthetic transaction level for browser tests. The following table explains each of these detector types:
Detector type |
Description |
|---|---|
Test-level detectors |
Test-level detectors send alerts on metrics that correspond to an entire test.
Examples: Send an alert when the count of failed runs, % uptime, or duration of the entire test exceeds a given threshold.
|
Page-level detectors |
Page-level detectors send alerts on metrics that correspond to a single page within a browser test.
Examples: Send an alert when the DOM load time, largest contentful paint (LCP), or total image size on a given page exceeds a given threshold.
If you don’t scope your alerts to the page level for page-level metrics, the detector monitors the average metric value across pages. See Set up reminders for alerts to learn more.
|
Transaction-level detectors |
Synthetic transaction-level detectors send alerts on metrics that correspond to a synthetic transaction within a browser test.
Examples: Send an alert on the three transaction-level metrics that Splunk Synthetic Monitoring captures (duration, requests, and size). See Create a transaction-level detector for a Browser test to learn more.
|
Best practices for sending an alert when a synthetic test fails 🔗
You can set up a detector while initially creating or editing a test, or from the results view for a particular test. A detector can track one or more synthetic tests.
To set up a detector, do one of the following:
When creating or editing a test, select Create detector to open the detector dialog box.
From the Test results page for a particular test, select Create detector to open the detector dialog box.
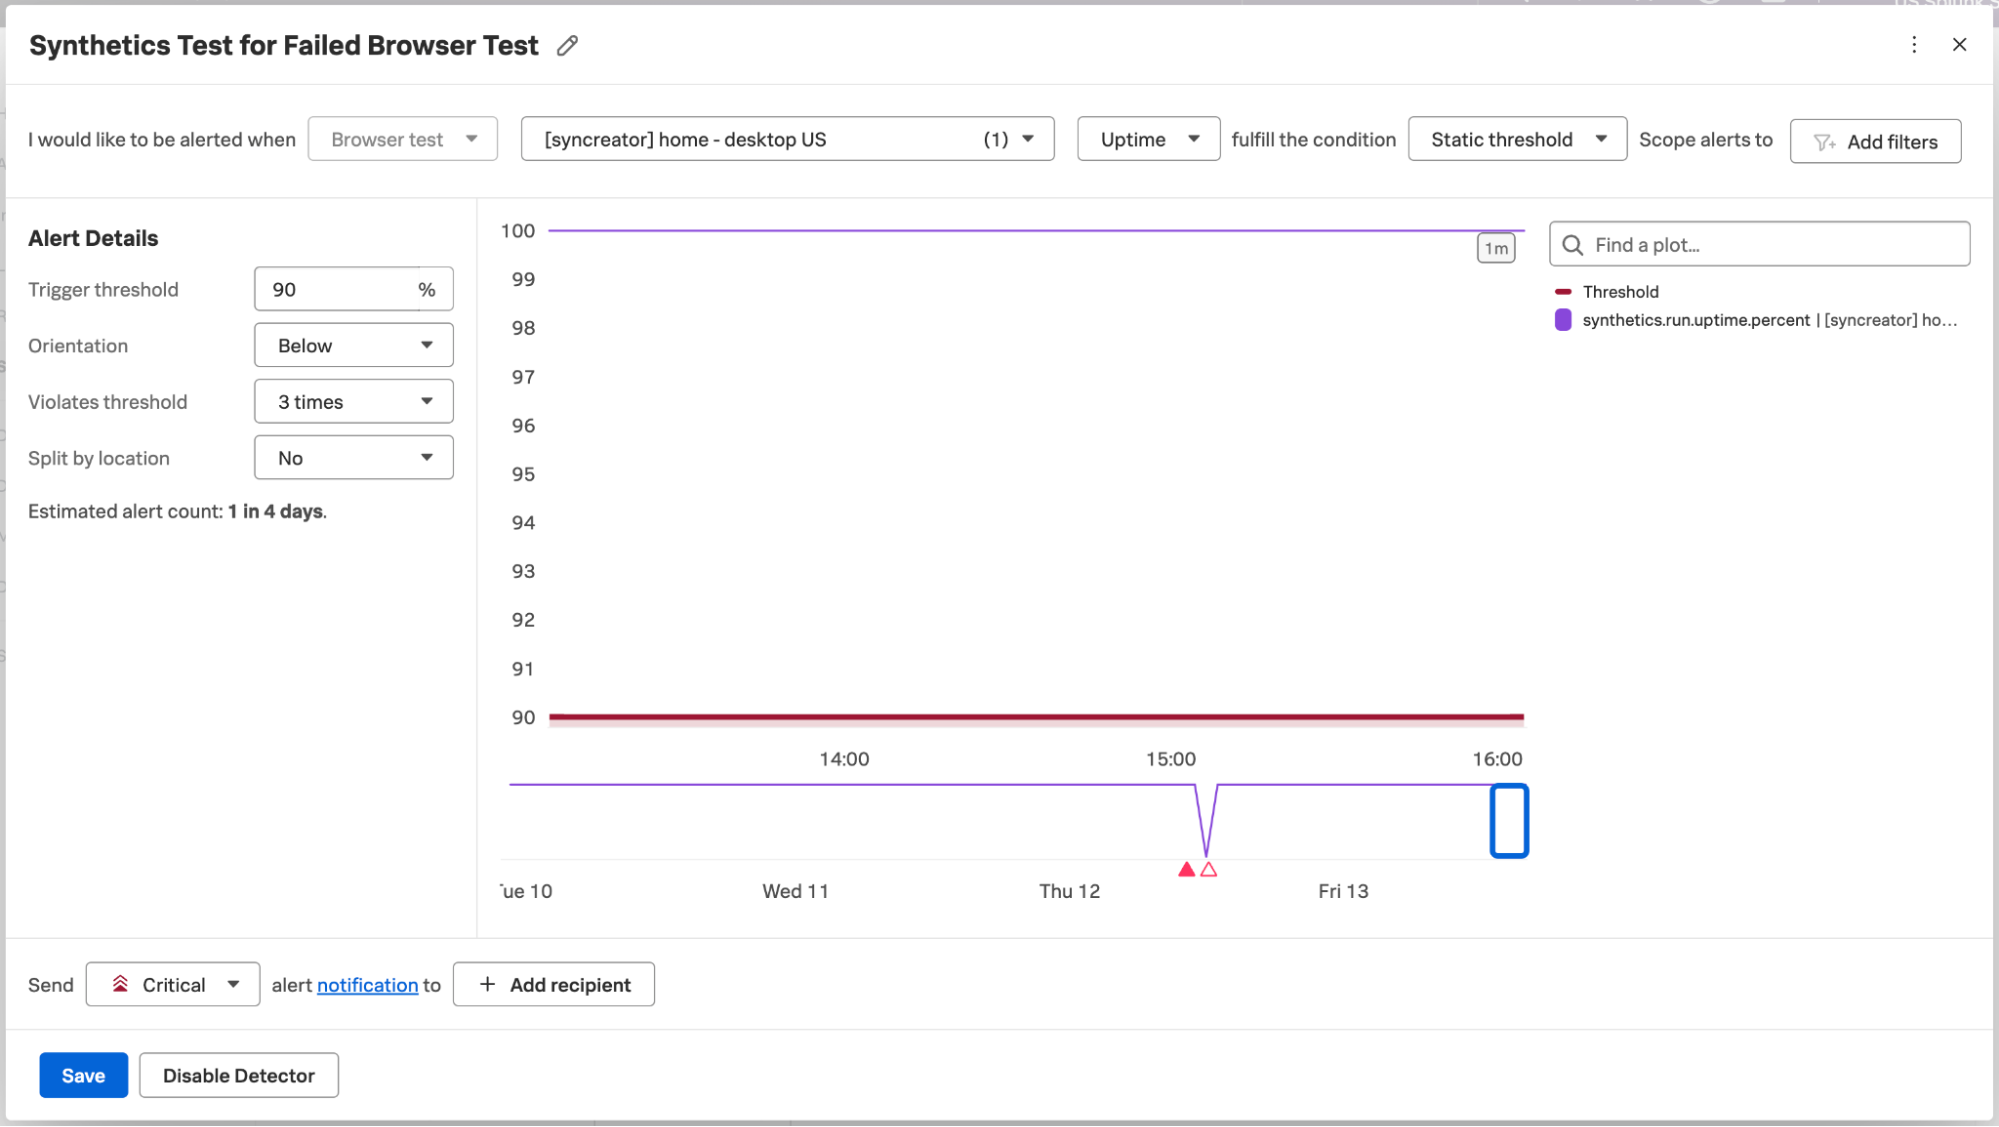
In the detector dialog box, enter the following fields:
In the test name list, select the tests you want to include in your detector. Best practice is to select tests that have a similar run length.
In the metric list, select Uptime. The uptime metric is 0 when the test fails.
In + Add filters don’t add filters for failed or success. Omit these filters to ensure that the detector sees all datapoints for the test run.
In the Alert details section, enter the following:
Trigger threshold: The threshold to trigger the alert.
Orientation: Whether the metric must fall below or exceed the threshold to trigger the alert.
Violates threshold: How many times the metric must violate the threshold to trigger the alert.
Split by location: Whether to split the detector by test location. If you don’t split by location, the detector monitors the average value across all locations.
Use the severity selector to set the severity of the alert.
Add recipients.
Select Activate.
Your detector is now set up to check for failed test runs every minute and to send an alert based on your settings in Alert details.
Set up a detector for Splunk Synthetic Monitoring tests 🔗
You can set up a detector while initially creating or editing a test, or from the results view for a particular test. A detector can track one or multiple Synthetic Monitoring tests of the same type.
To set up a detector, do one of the following:
While creating or editing a test, select Create detector. The detector dialog box opens.
From the Test results page for a particular test, select Create detector. The detector dialog box opens.
In the detector dialog box, enter the following fields:
In the test name list, select the tests you want to include in your detector. If you want to include all tests you see in the list, select the All tests check box.
Note
The All tests option uses wildcard ( * ) in the program text and always covers all tests of the same type.
In the metric list, select the metric you want to receive alerts for. By default, a detector tracks Uptime metric.
The default Static threshold alert condition can’t be changed.
Select + Add filters to scope the alerts by dimension. For Browser tests, you can use this selector to scope the detector to the entire test, a particular page within the test, or a particular synthetic transaction within the test. See the following sections for details:
In the Alert details section, enter the following:
Trigger threshold: The threshold to trigger the alert.
Orientation: Only available for uptime metric. Specify whether the metric must fall below or exceed the threshold to trigger the alert.
Violates threshold: How many times the metric must violate the threshold to trigger the alert.
Split by location: Select whether to split the detector by test location. If you don’t filter by location, the detector monitors the average value across all locations.
Auto-clear alerts: Select the check box and a time duration from the list if you want active alerts to automatically clear after the metric hasn’t reported new data for the specified period. To learn more, see Auto-clear alerts.
Use the severity selector to select the severity of the alert.
Add recipients.
Select Activate.
Set up reminders for alerts 🔗
To receive reminders for alerts triggered by your detectors, do the following while creating your detector:
Select the alert severity that will trigger a notification and the channel used to receive the reminder notification. For example, select Email to receive email notifications.
Select the + button labeled Scope alerts to.
Under Find a key, select the
page_positiondimension.
Create a page-level detector for a Browser test 🔗
To create a page-level detector, do the following while creating your detector:
While choosing a metric for the detector to alert on, select a metric that applies to the page level. Don’t use metrics such as Run Duration or Run count, which apply to the entire Browser test run, not a specific page within the test.
Select the + button labeled Scope alerts to.
Under Find a key, select the
page_positiondimension.Under Find a value, select the number corresponding to the page you want to monitor. Page position 0 is the first page your Browser test interacts with, position 1 is the second page in your test, and so on.
Finish setting up your detector. See Set up a detector for Splunk Synthetic Monitoring tests above.
Note
If you don’t scope your alerts to a specific page for a page-level metric, the detector tracks the average metric value across all pages in your test.
If you select multiple pages, your detector monitors the aggregate metric value for the multiple pages you selected.
If you want a detector monitoring the metric value for each of the pages in your test, create a separate detector for each page you want to monitor.
Create a transaction-level detector for a Browser test 🔗
To create a transaction-level detector, do the following while creating your detector:
While choosing a metric for the detector to alert on, select one of the following transaction-level metrics:
Duration
Requests
Size
Select the + button labeled Scope alerts to.
Under Find a key, select the
transactionortransaction_positiondimension. Using thetransactiondimension allows you to identify transactions by name rather than numerical position.Under Find a value, select the synthetic transaction you want to monitor.
Finish setting up your detector. See Set up a detector for Splunk Synthetic Monitoring tests above.
Note
If you don’t scope your alerts to a specific transaction for a transaction-level metric, the detector tracks the average metric value across all transactions in your test.
If you select multiple transactions, your detector monitors the aggregate metric value for the multiple transactions you selected.
If you want a detector monitoring the metric value for each of the transactions in your test, create a separate detector for each transaction you want to monitor.
See also 🔗
To learn more about synthetic transactions in Browser tests, see Add synthetic transactions to your Browser Test.