Compare run results to Web Vitals with Splunk RUM 🔗
Splunk Synthetic Monitoring automatically collects Web Vitals for Browser tests. If you also want to measure Web Vital metrics against your run results, then integrate Splunk Synthetic Monitoring with Splunk RUM. Web Vitals capture key metrics that affect user experience and assess the overall performance of your site. Many businesses rely on search engines for users to discover their sites. Google uses Web Vitals to determine page ranking.
Metric name |
Description |
|---|---|
Largest contentful paint (LCP) |
Measures loading performance by capturing the render time of the largest image or text block visible within the viewport. |
Cumulative layout shift (CLS) |
Measures visual stability by capturing the sum of all individual layout shift scores for every unexpected layout shift that occurs during the entire lifespan of the page. A layout shift occurs any time a visible element changes its position from one rendered frame to the next. Fewer shifts are better for page stability. |
Interaction to next paint (INP) |
Measures responsiveness by observing all user interactions on a page and capturing the longest time it takes the browser to respond to an interaction. |
Total blocking time (TBT) |
Measures the time it takes a page to become interactive and responsive for a user. TBT is considered a lab proxy for INP, when INP might not be captured. Both TBT and INP can be improved by [optimizing interactions](https://web.dev/articles/optimize-inp#optimize_interactions). |
Prerequisites 🔗
To measure Web Vital metrics against your run results, you need to instrument your browser application with Splunk RUM. See, Instrument browser-based web applications for Splunk RUM.
Compare Web Vitals for your run results 🔗
Follow these steps to compare run results to Web Vitals. Web Vitals are a great way of measuring if your tests are actually capturing the performance you expect, such as if you want to compare the latency of your tests by run location. Open the run results of your test.
In Splunk Synthetic Monitoring, navigate to the run results page for the test you’re interested in monitoring. The metrics panel for each run result lists Web Vitals, performance timing, and other metrics. Each Web Vital shows how your metrics compare to the acceptable range.
Good: < 100 ms
Improve: 100 ms - 300 ms
Poor: > 300 ms
Select the flashlight icon to open the sessions in Tag Spotlight.
Review the visits count to find the number of users and synthetic tests that have interacted with the normalized URL specified in the test.
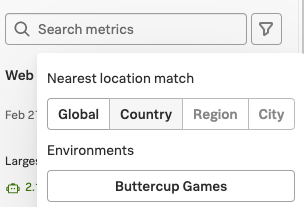
To compare latency of a test by run location, select the filter icon to change the location.
See also 🔗
See Scenario: Compare run results to Web Vitals with Splunk RUM
See https://web.dev/vitals/ in the Google developer documentation to learn more about Web Vitals.
See Error monitoring and crash aggregation in Tag spotlight to learn more about Tag Spotlight.