Scenario: Jax identifies slow database queries using Database Query Performance 🔗
Jax, a site reliability engineer, is in charge of identifying the root cause of service latency issues in their system. In this section, follow their workflow using Database Query Performance to examine the relationship between service latency and the performance of database queries in their system.
Noticing unusually high latency 🔗
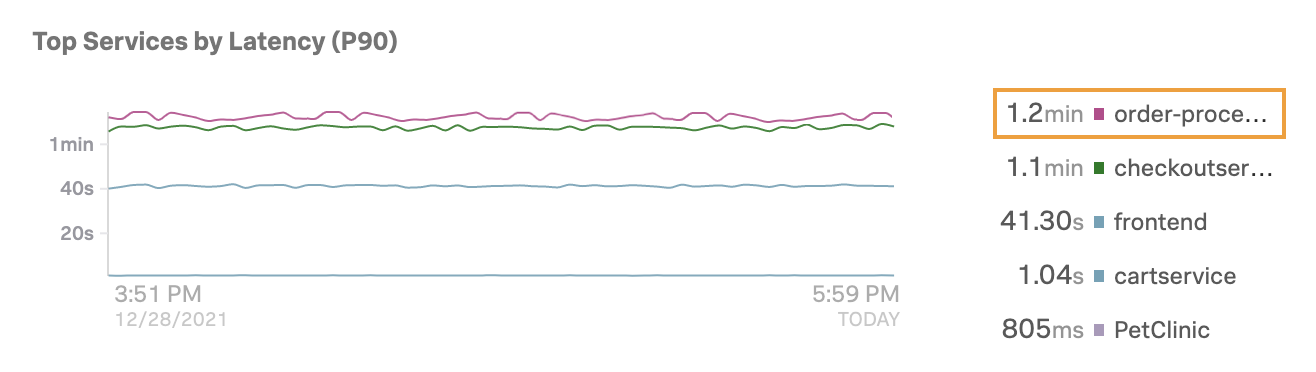
Jax is monitoring their system performance and notices in the APM landing page that the order-processor service is experiencing an unusually high latency of 1.2 minutes:
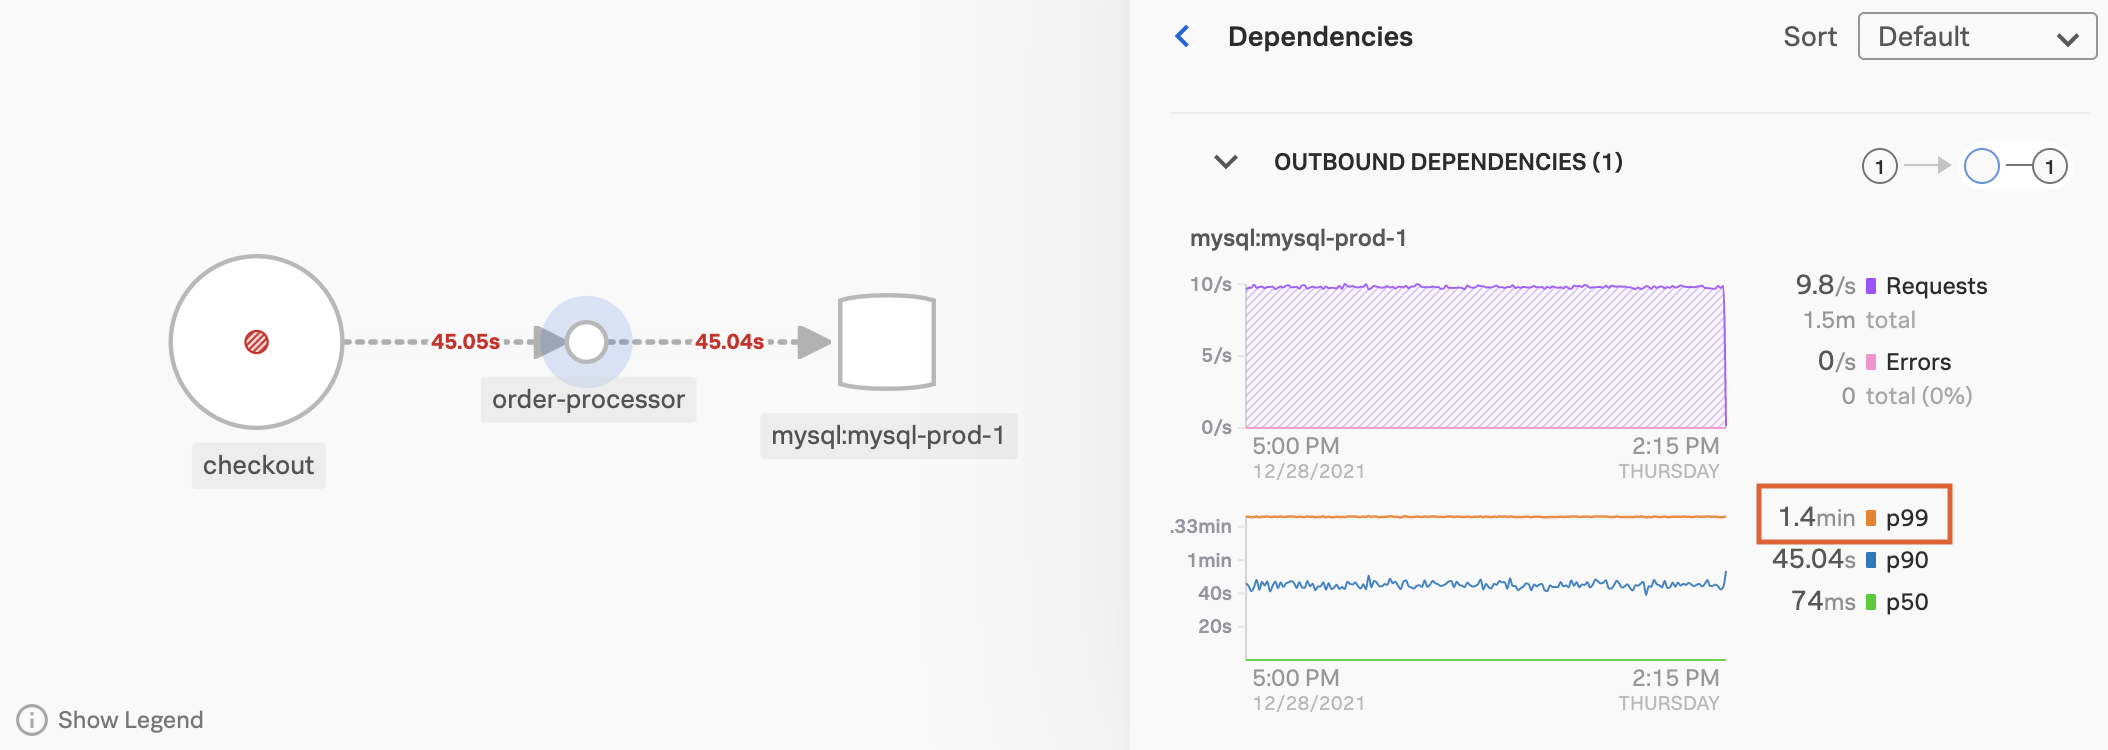
They select the latency value to the service map view of this service and its dependencies. The panel shows a graph of the service’s latency over time compared to the latency of its dependencies. They select Dependencies to open the Dependencies panel and get a closer look at the dependent services for order-processor. Scrolling down to Outbound Dependencies, they notice that the P90 latency for the mysql:mysql-prod-1 database is also very high:
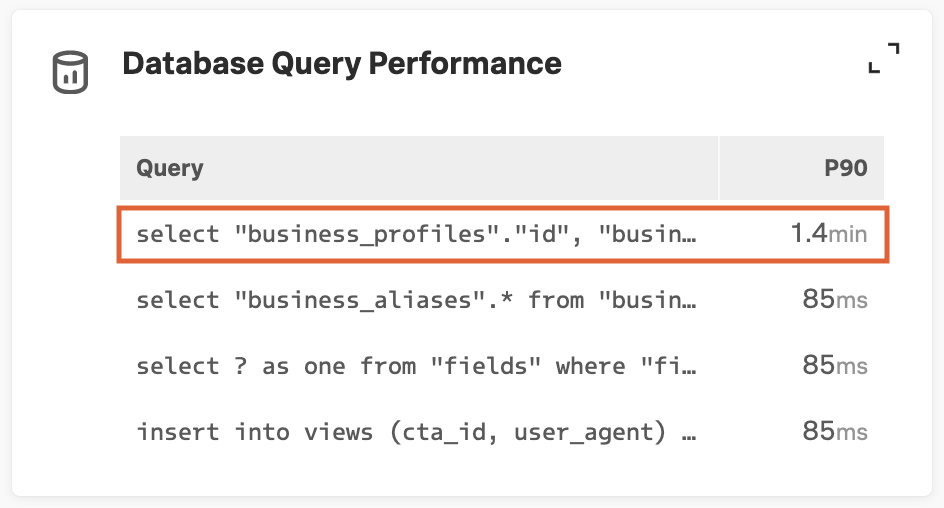
They select the mysql:mysql-prod-1 database in the service map to see summary charts of its requests and latency in the sidebar. The Database Query Performance panel in the sidebar shows the P90 latency of the slowest SQL queries within the current time range. They notice that the P90 latency of the top query is also 1.4 minutes:
Checking the database infrastructure 🔗
Before digging into Database Query Performance, Jax wants to make sure that there are no issues in the infrastructure of the mysql:mysql-prod-1 database. Using the Related Content feature, Jax is able to immediately identify the MySQL host, which appears in the Related Content bar after they click on the inferred database.
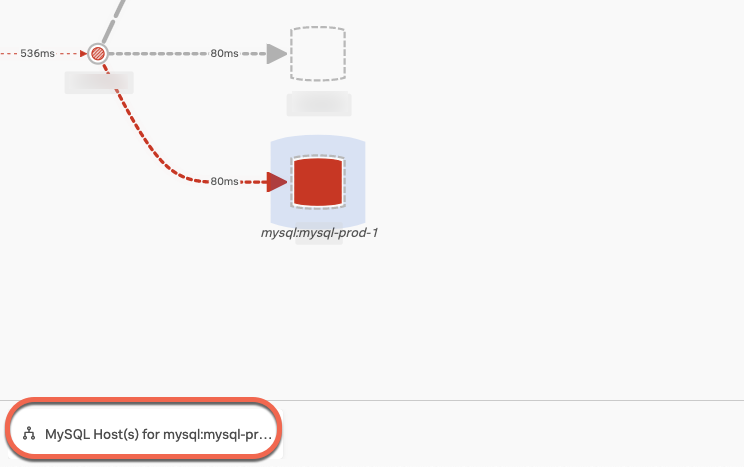
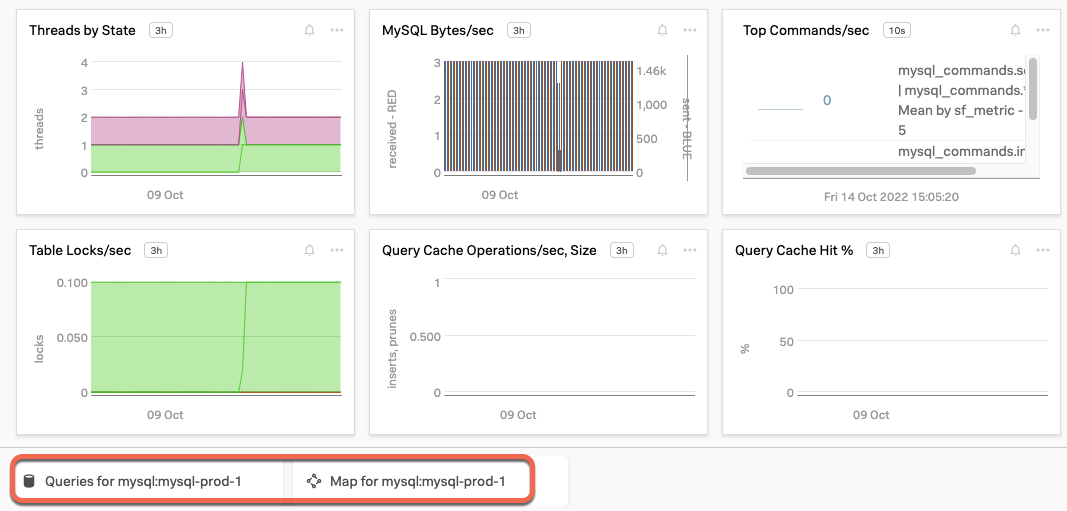
After they select the host, Jax can verify that the infrastructure is not the cause behind the latency, as the infrastructure metrics appear normal. The Related Content bar for the host contains a tile that links to Database Query Performance, as well as others for APM and Log Observer.
Analyzing queries in Database Query Performance 🔗
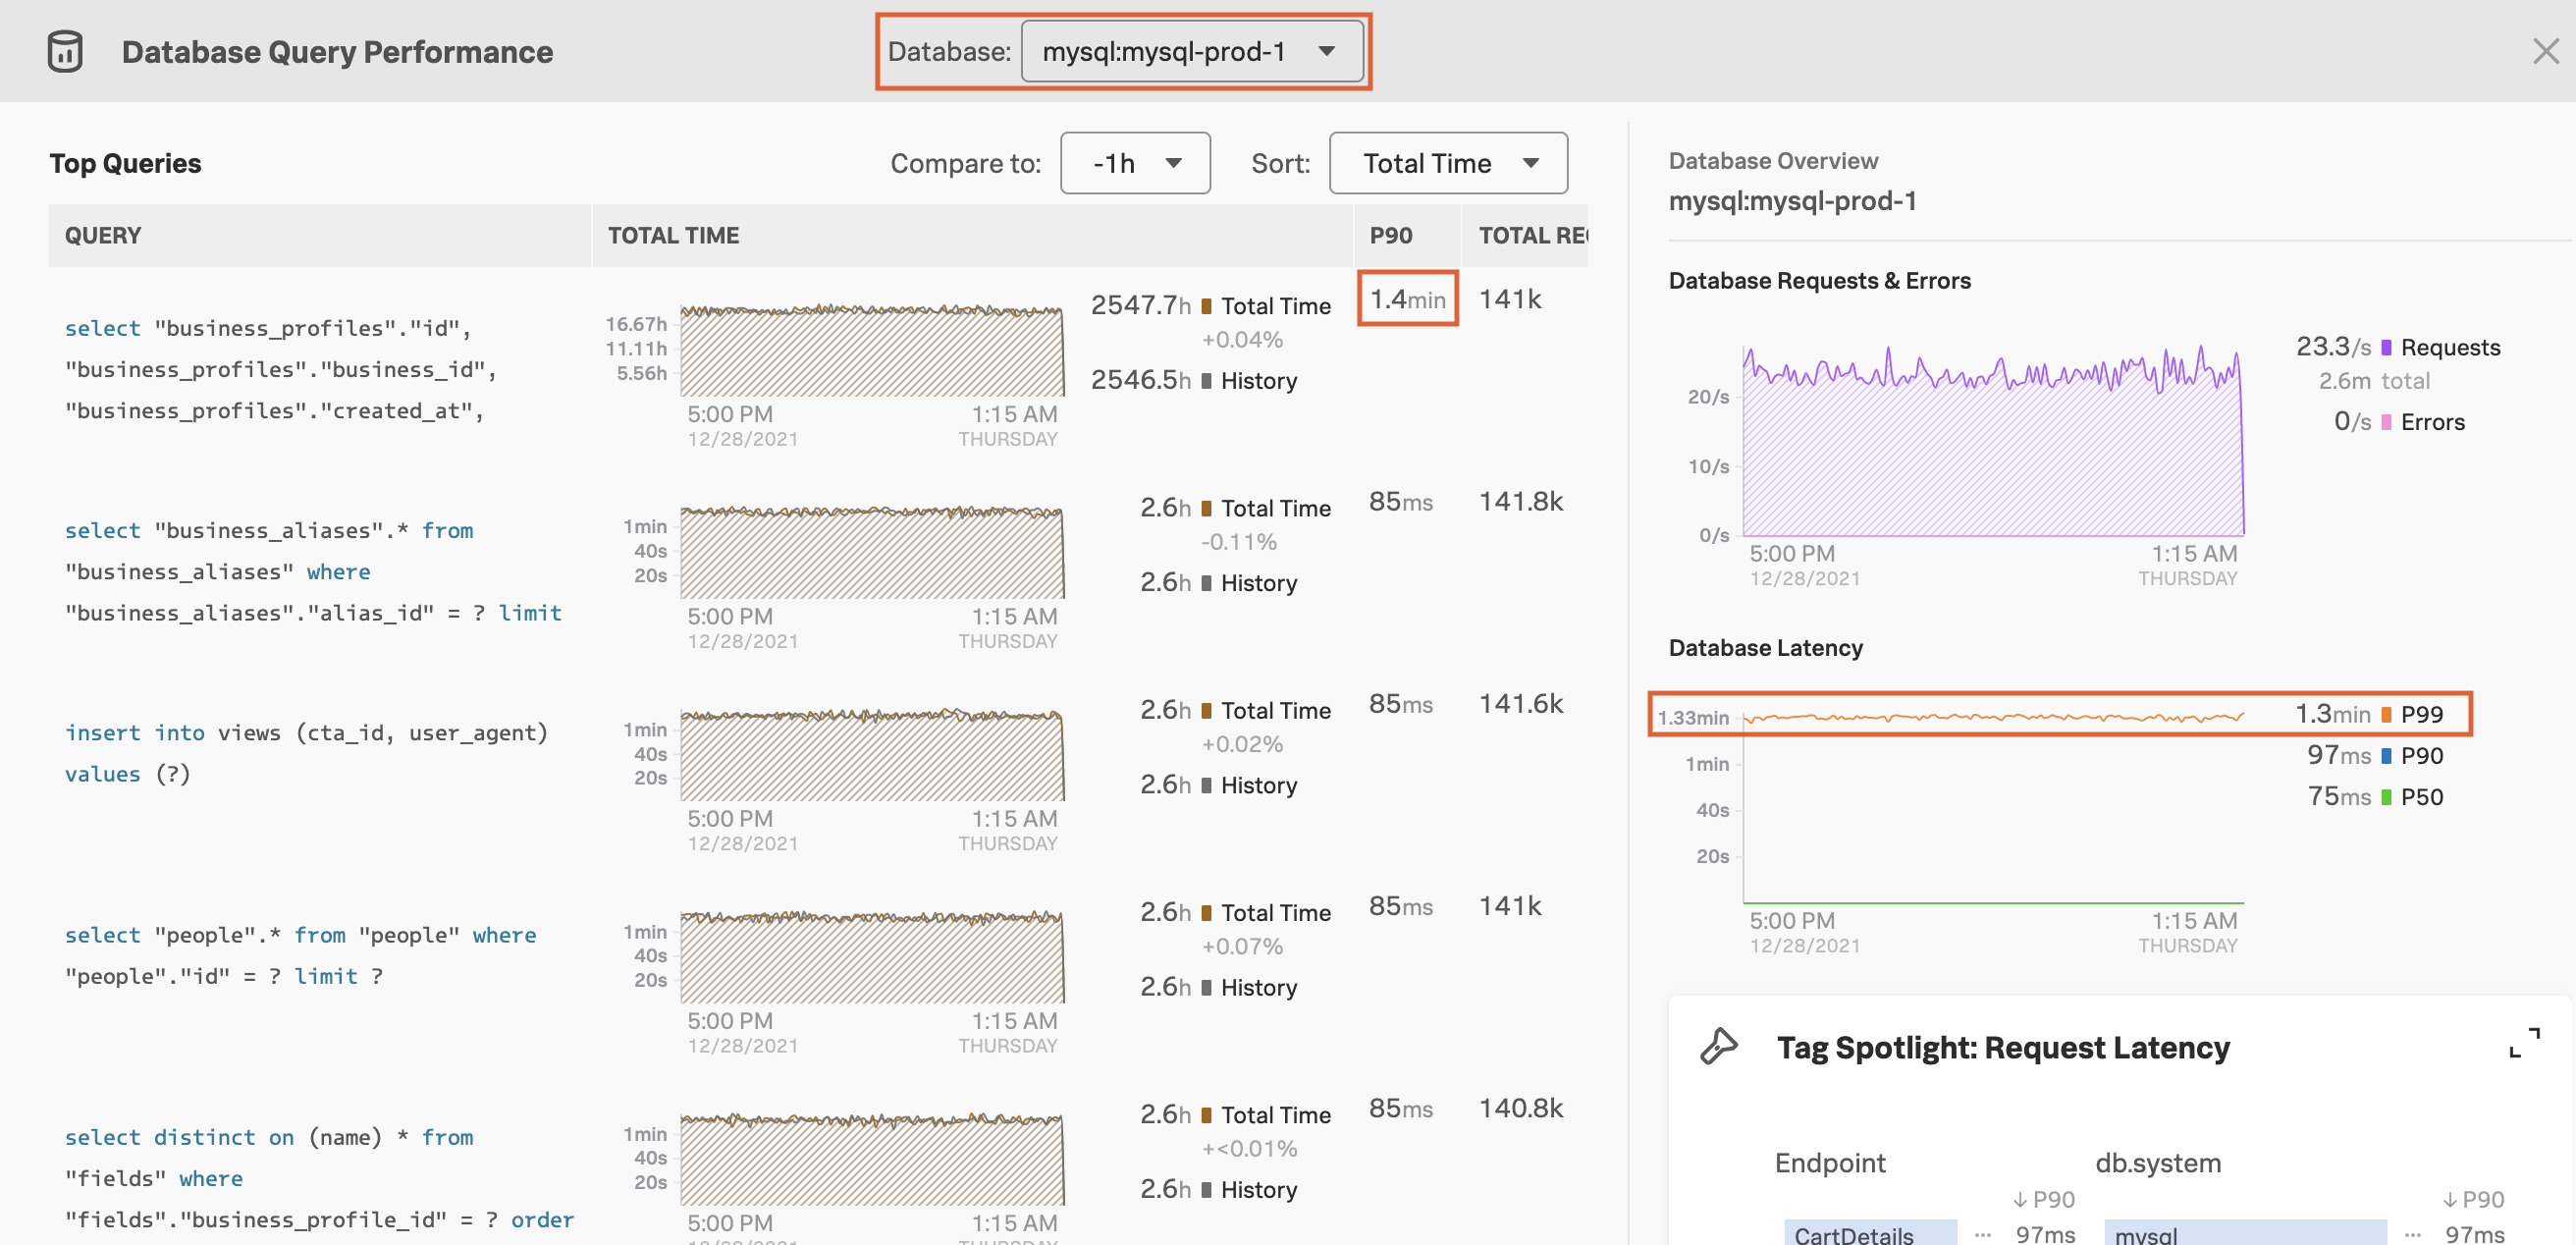
Jax selects this panel to open Database Query Performance. The data they see in Database Query Performance applies to the mysql:mysql-prod-1 database selected in the filter bar:
Jax could also use the database picker to select from among available SQL databases, but now they want to focus on mysql:mysql-prod-1.
The table under Top Queries shows a list of the top 10 queries to mysql:mysql-prod-1, sorted by default in descending order by total time. Jax can use the Sort picker to sort by P90 latency or requests per second instead. They can also use the Compare to: picker to compare the current data against a past time range. This overlays a historical line based on the selected time range on the chart in each row of the query table, enabling Jax to determine whether the problem is recent, or has been occurring over time.
The charts under Database Overview in the sidebar summarize the latency and request and error rate for all queries in the selected database, illustrating trends in query latency over time. The charts are based on the current state of the filter bar. Changing the time range or environment pickers in the filter bar changes the data shown in the chart.
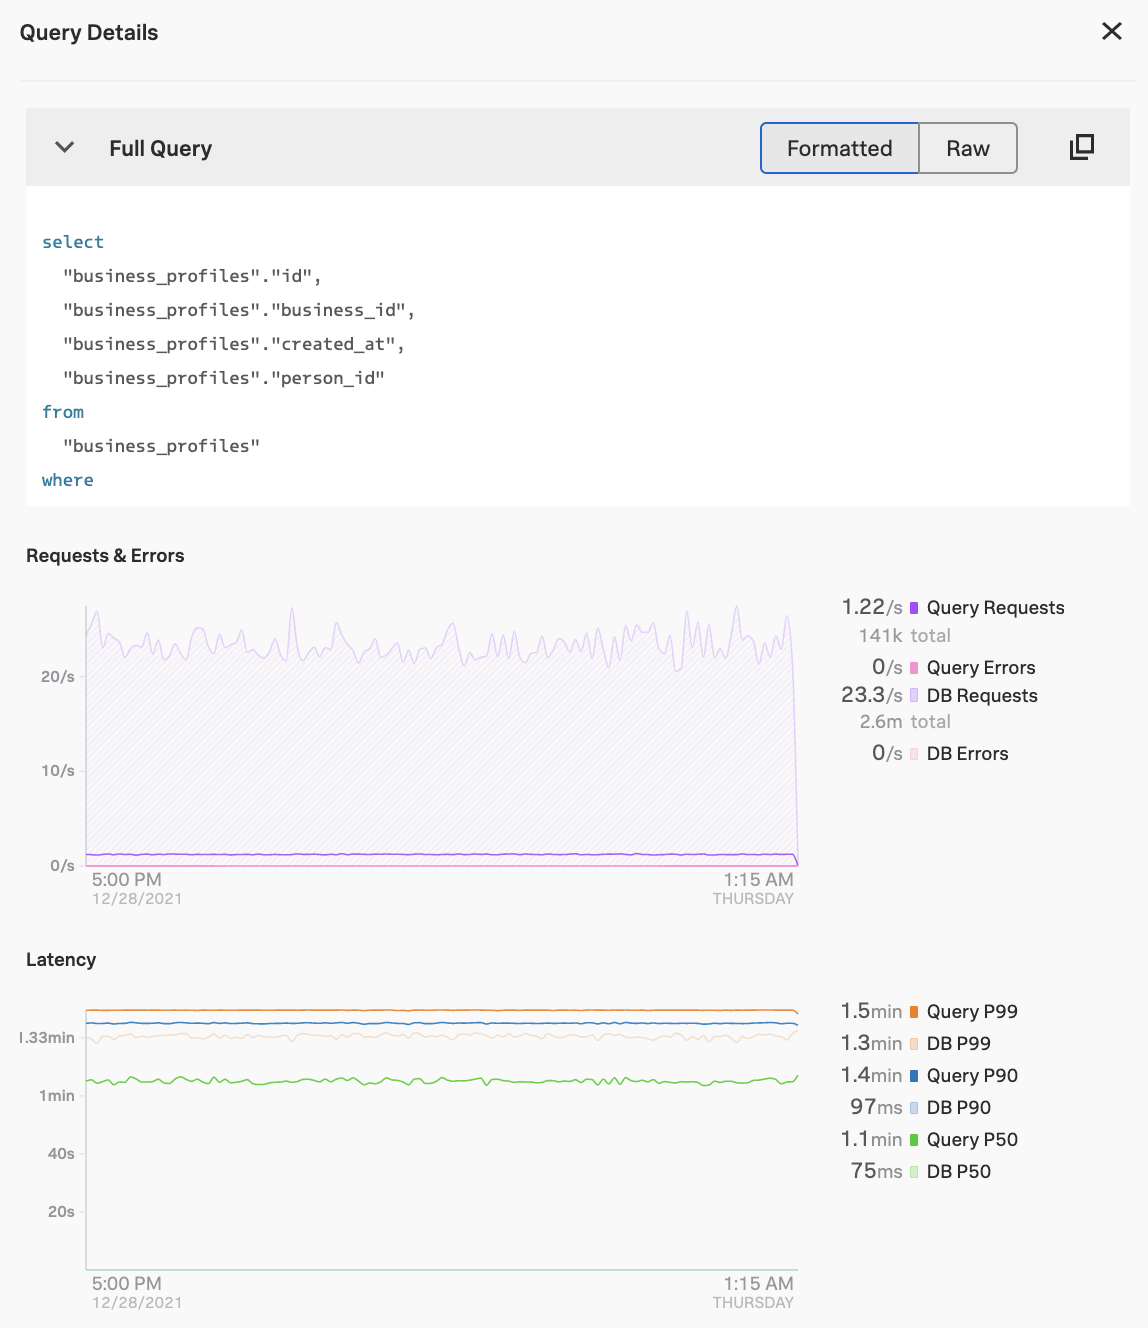
Jax selects the query with the highest latency to get more details. The Query Details panel opens, showing the full text of the query along with the Requests & Errors and Latency charts for that particular query. They notice that the query’s latency has been as high as 1.5 minutes:
Based on this evidence, Jax identifies this query as the possible culprit of the high service latency. Jax selects the copy button to copy the text of the statement so they can give it to their team’s database administrator.
Finding example traces 🔗
To determine whether the high latency is coming from multiple spans with many executions of a particular query, or from a single, long span with one execution of a slow query, Jax decides to look for example traces containing this problematic query.
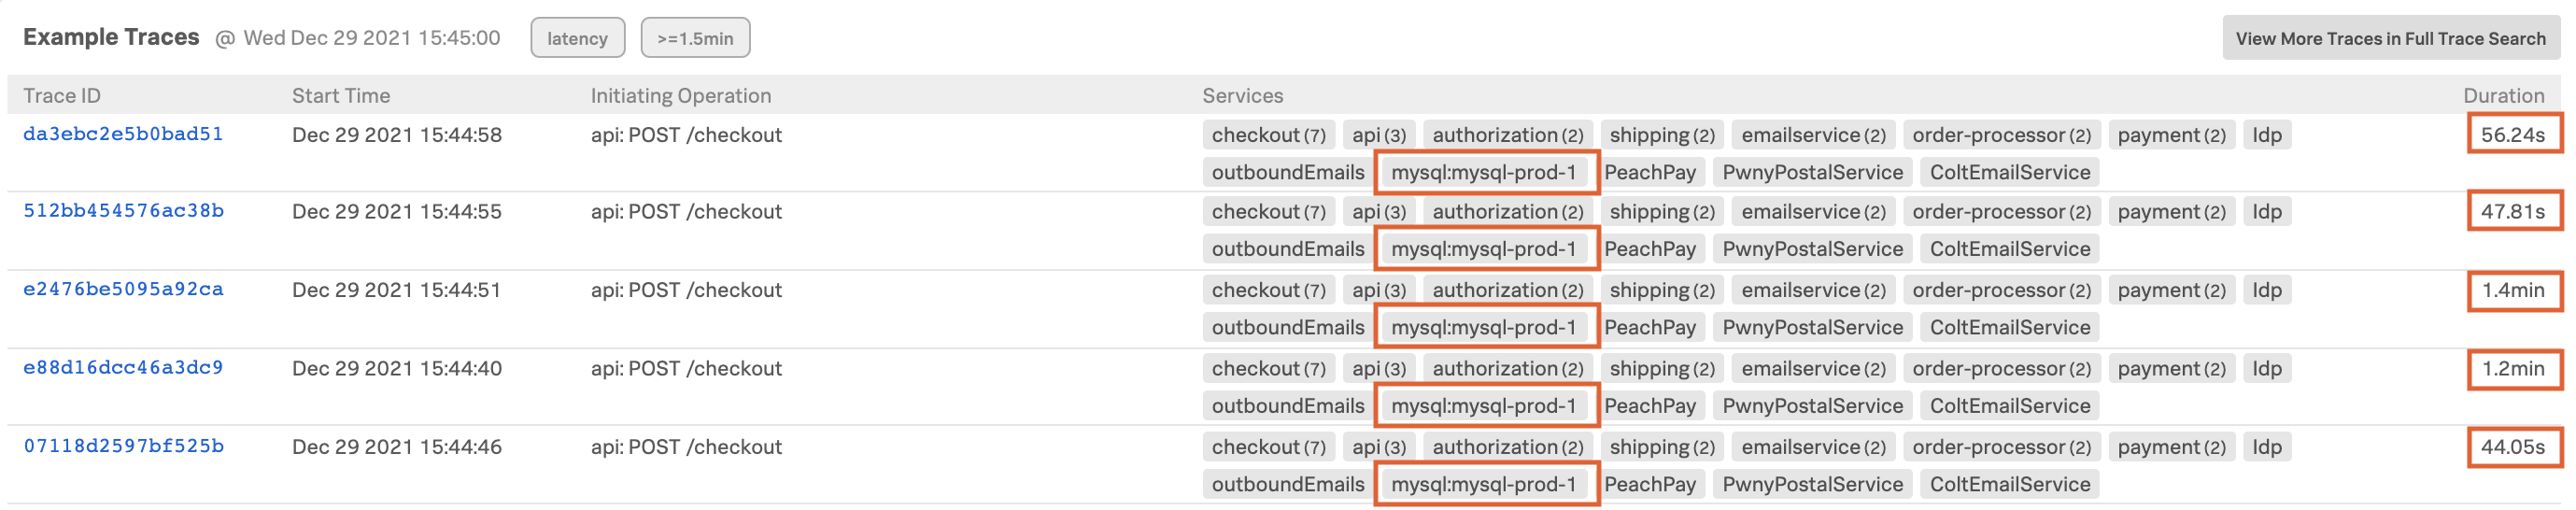
Jax clicks within the latency chart to isolate a time on the x-axis and load a table of example traces from that time. They confirm that each of the loaded traces contains mysql:mysql-prod-1 as a span tag. They also notice that these traces all have unusually long durations, probably due to the slow database query they have identified:
From the table of traces, Jax selects the trace in the table with the longest duration to open its Trace View page and waterfall chart. They could also select a span tag containing the database name to open the span with the problematic query to see the exact query in context.
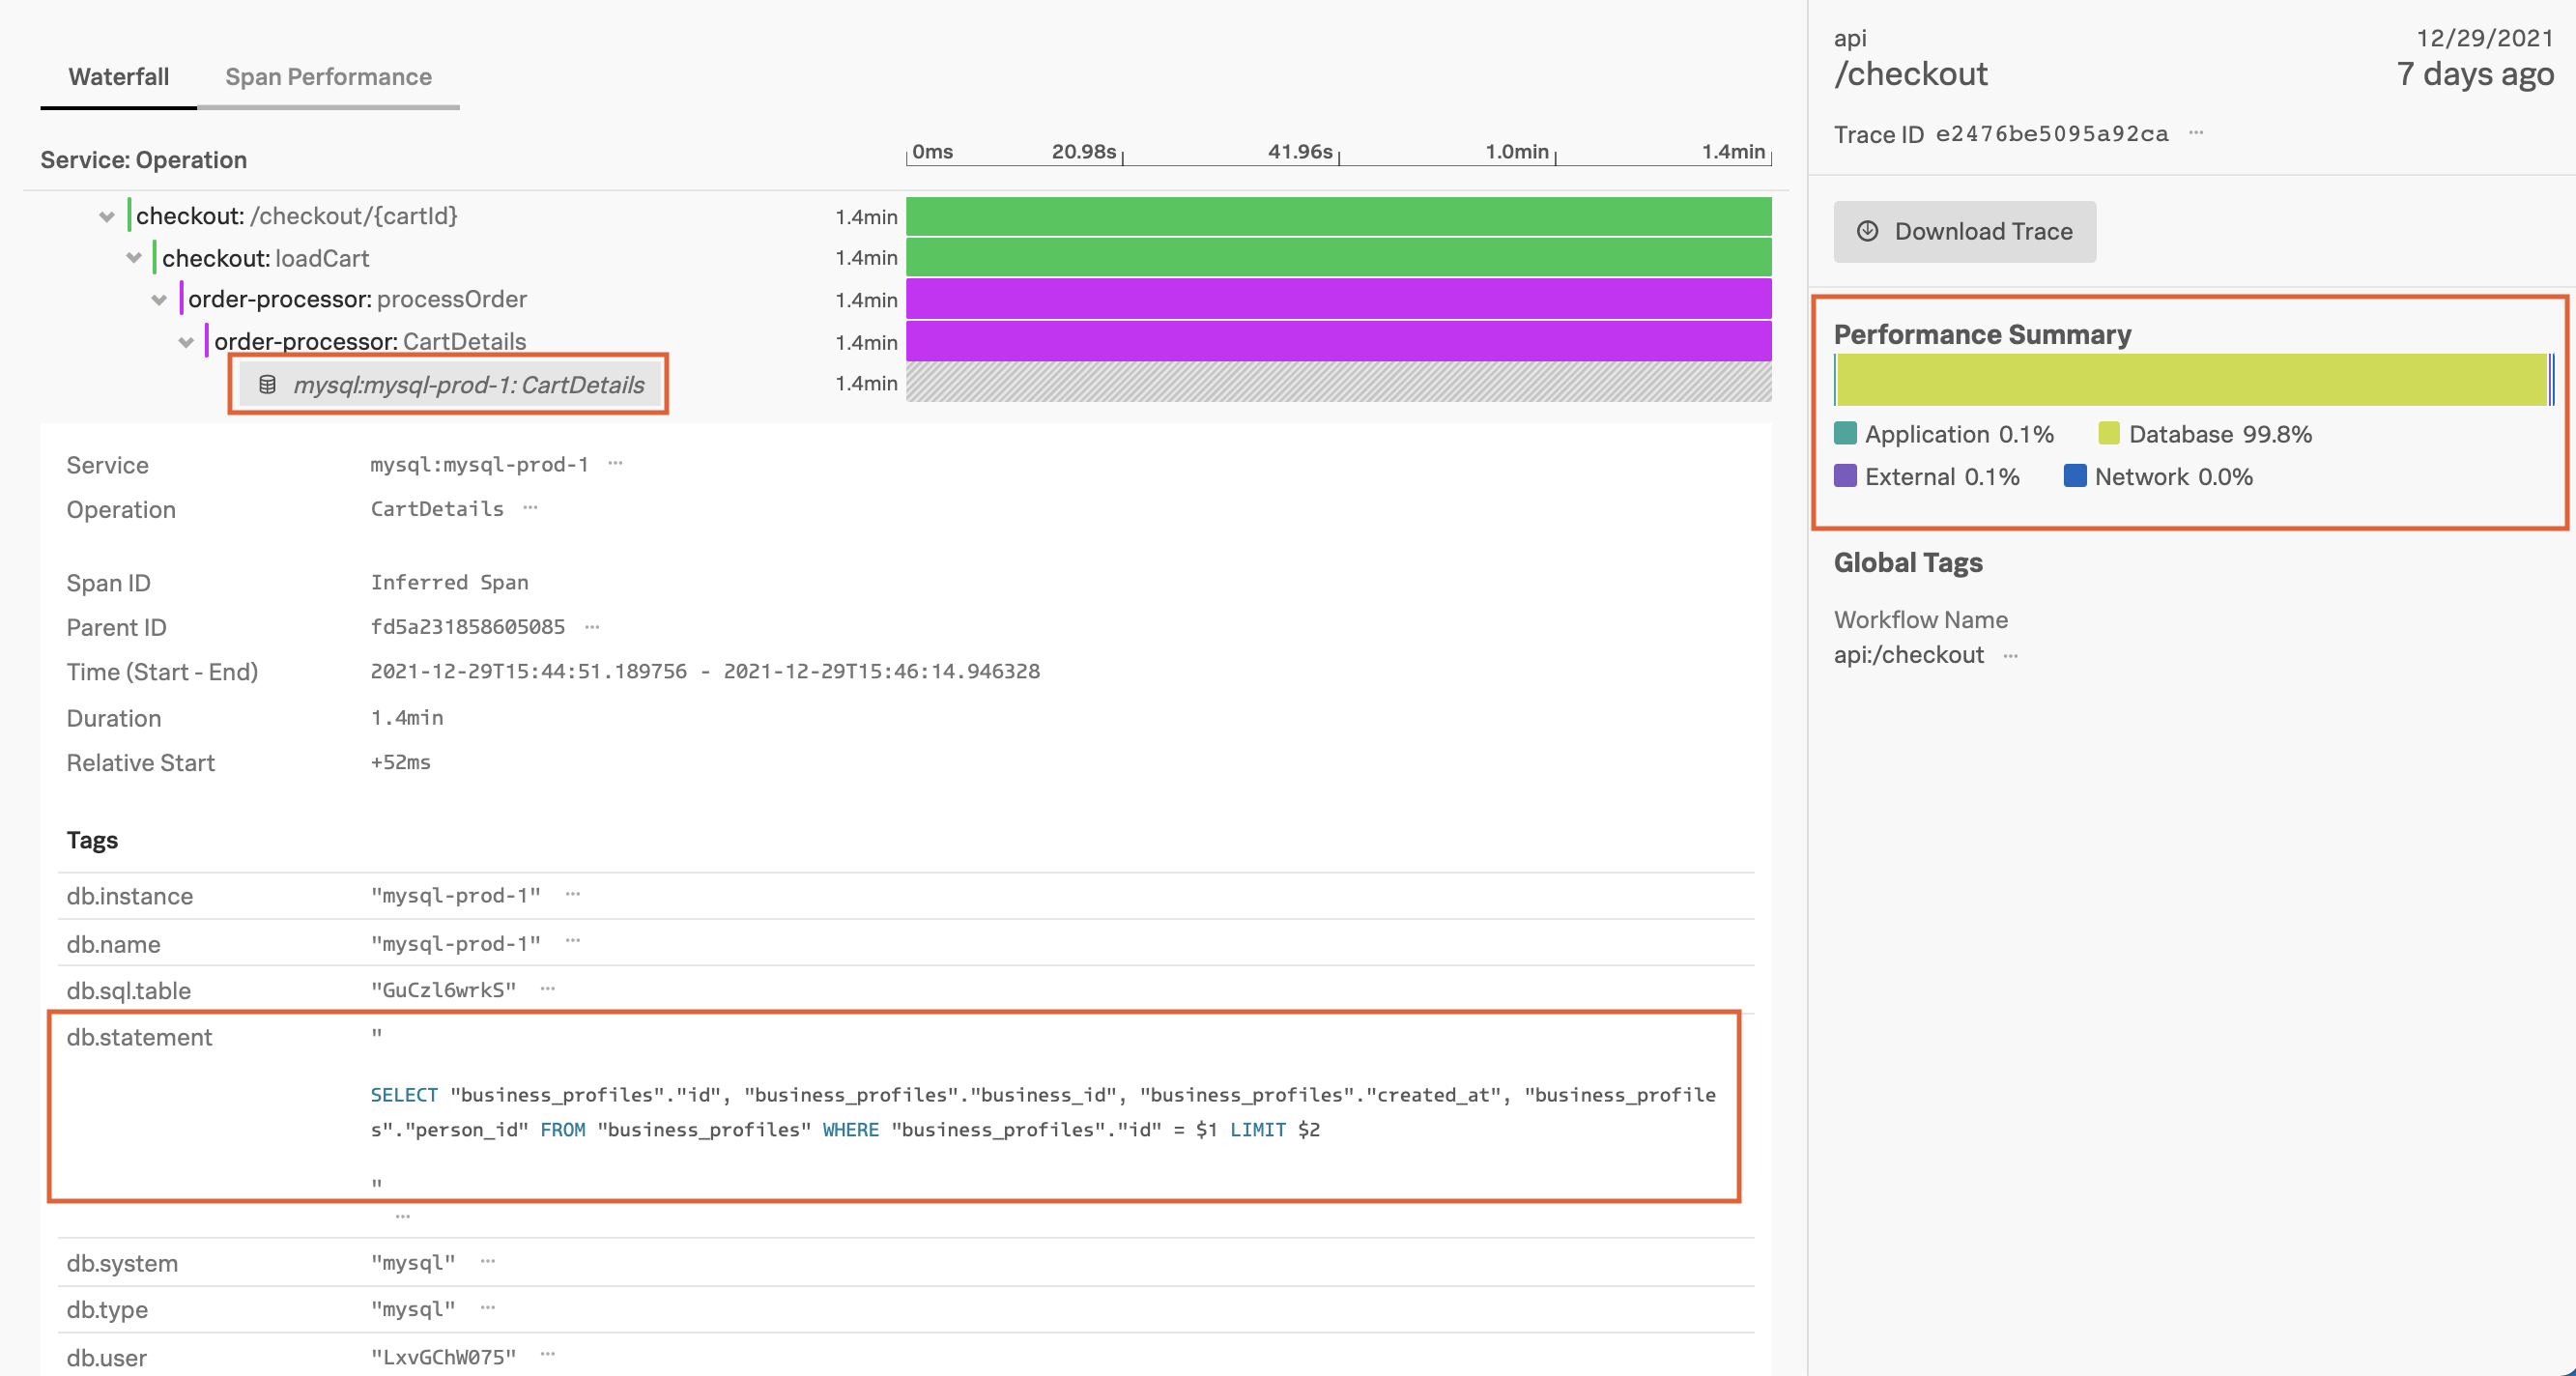
In Trace View, Jax scrolls to find a span that references the mysql:mysql-prod-1 database, which is identified as an inferred service in the Trace Waterfall. They select this span to open it and view the query under the db.statement span tag, confirming that it’s the same SQL statement that raised their suspicions in Database Query Performance view.
Jax notices that the span containing the database call is much longer than all of the other spans in the trace, indicating the high latency they’re seeing is related to one long span. The Performance Summary in the right sidebar also shows that 99.8% of the trace workload is occupied by the Database category:
Tip
If the database query is long and has been truncated in the span, you can select the Related Content tile at the bottom of the page to pivot into Log Observer and view the full query in logs.
Armed with this knowledge, Jax contacts the DBA who supports this database and provides the exact text of the query that’s causing problems. Jax asks them to investigate the source of this latency and optimize the database call to prevent further issues with service latency.
To continue to investigate the wider impact of this latency issue, Jax could use Tag Spotlight to determine which database span tags and values are associated with the highest latency, and see which Business Workflows are affected by this issue. For an example scenario for troubleshooting using Tag Spotlight, see Scenario: Deepu finds the root cause of an error using Tag Spotlight.
Learn more 🔗
See the following links for more information about Database Query Performance:
For an overview of Database Query Performance, see Monitor Database Query Performance.
To turn on Database Query Performance, see Turn on Database Query Performance.
To learn more about Related Content, see Related Content in Splunk Observability Cloud.
To troubleshoot issues with Database Query Performance, see Troubleshoot Database Query Performance.
For reference material about Database Query Performance, see Reference for Database Query Performance.