Troubleshoot Splunk-managed Metric Streams 🔗
See the following topics when experiencing AWS Metric Streams related issues.
Note
See also Troubleshoot your AWS integration and Troubleshoot AWS-managed Metric Streams.
I’ve enabled Splunk-managed Metric Streams in my AWS integration but I do not see any metrics streaming in 🔗
After all the required IAM permissions are in place, your AWS integration is configured, and one of the CloudFormation templates has been deployed, Splunk Observability Cloud starts to create CloudWatch Metric Streams objects in your AWS account. It might take up to 15 minutes for metrics to start streaming.
If you’re experiencing issues streaming metrics, check the following:
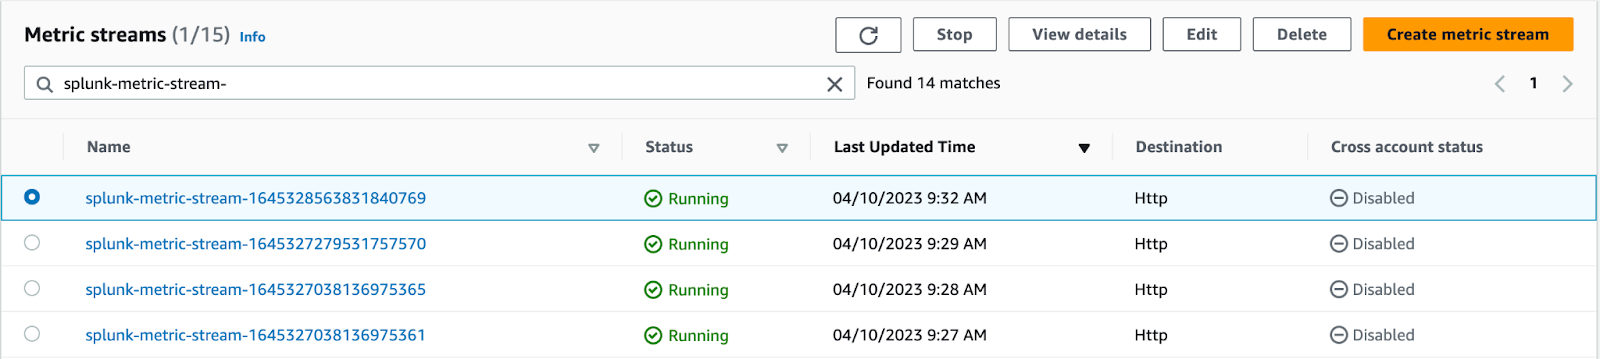
In the AWS CloudWatch Metric Streams console, verify that Metric Streams (automatically created by Splunk Observability Cloud) match the
splunk-metric-stream-<integration-id>pattern. If Metric Streams are not present, review the Metric Streams set-up procedure.CloudFormation parameter values:
Set
SplunkIngestUrlto the value shown in the Real-time Data Ingest Endpoint section under Organizations in your profile. For example, https://ingest.signalfx.com.Note: Don’t include the /v1/cloudwatch_metric_stream endpoint path in
SplunkIngestUrl. However, when checking metric stream destination details you should see full URL with the endpoint included, e.g. https://ingest.signalfx.com/v1/cloudwatch_metric_stream.SplunkAccessTokenneeds to be a valid organization access token withINGESTauthorization scope. You can find access tokens in the Access Tokens page in the Splunk Observability Cloud settings.
Make sure the tag
splunk-metric-streams-firehose = <your_AWS_region>is present in your Kinesis Data Stream.In the AWS Kinesis Streams console, validate that metrics are being delivered to the Kinesis Stream created by the CloudFormation template.
In the AWS S3 bucket used by Kinesis Firehose, check if there are any records that could not be delivered to Splunk Observability Cloud.
How can I track invalid Metric Streams? 🔗
Splunk Observability Cloud provides out-of-the-box dashboard to help you track invalid or faulty Metric Streams, including:
Streams without a matching AWS integration on the Observability side.
Streams from a disabled integration or Metric Stream feature.
To access these dashboards, go to Dashboards > Organization metrics > Cloud integrations, and look for Invalid AWS CloudWatch Metric Streams.
To learn more about built-in content, see Built-in dashboards.
How does Splunk-managed Metric Streams clean-up work? How can I try to clean up Metric Streams again? 🔗
When you deactivate Splunk-managed Metric Streams (or an entire AWS integration), Splunk Observability Cloud attempts to remove all CloudWatch Metric Streams that had been created. This process might take up to 15 minutes.
The clean-up procedure might fail if you remove IAM permissions or due to throttling, for example if there are too many API calls to delete Metric Streams objects.
To retry the clean-up process, you have two options:
Splunk Observability Cloud UI (beta feature - limited availability): Go to the context menu in the integration list and select Cleanup.
API: Set
metricStreamsSyncStateto theCANCELLINGstate.
Assisted Splunk-managed Metric Streams clean-up failed. How do I clean up Metric Streams manually? 🔗
To manually remove Metric Streams:
Go to the AWS CloudWatch Metric Streams console in each region where you deployed a CloudFormation template.
Remove all Metric Streams with a name starting with the
splunk-metric-streamprefix followed by a numeric id.
Optionally, go to the CloudFormation console and remove the entire Splunk Observability Cloud stack.