Part 2: Instrument serverless functions to send traces and metrics 🔗
You can instrument your serverless functions, including AWS Lambda functions, Azure .NET functions, and Azure Node.js functions.
By integrating your serverless functions with Splunk, you can send traces to Splunk APM and metrics to Splunk Infrastructure Monitoring.
Instrument your serverless functions 🔗
To instrument your AWS Lambda serverless functions, see Instrument serverless functions for Splunk Observability Cloud.
View your serverless function data in Splunk Observability Cloud 🔗
After you’ve instrumented your serverless functions, you can access your data in the following locations:
View traces on the APM landing page 🔗
The Splunk APM landing page shows a preview of trace data coming from your serverless functions.
To learn more about the APM landing page, see Assess the health of your applications with the APM landing page.
View traces in the APM Explorer view 🔗
The APM explorer view offers detailed insights into your application data, including dependencies among your applications.
To learn how to use the explorer view, see View dependencies among your services in the service map.
View metrics in the Infrastructure Monitoring Lambda Functions navigator 🔗
Splunk Infrastructure Monitoring uses a special navigator for AWS Lambda functions.
For more information about finding and using this navigator, see Monitor AWS services and identify problems.
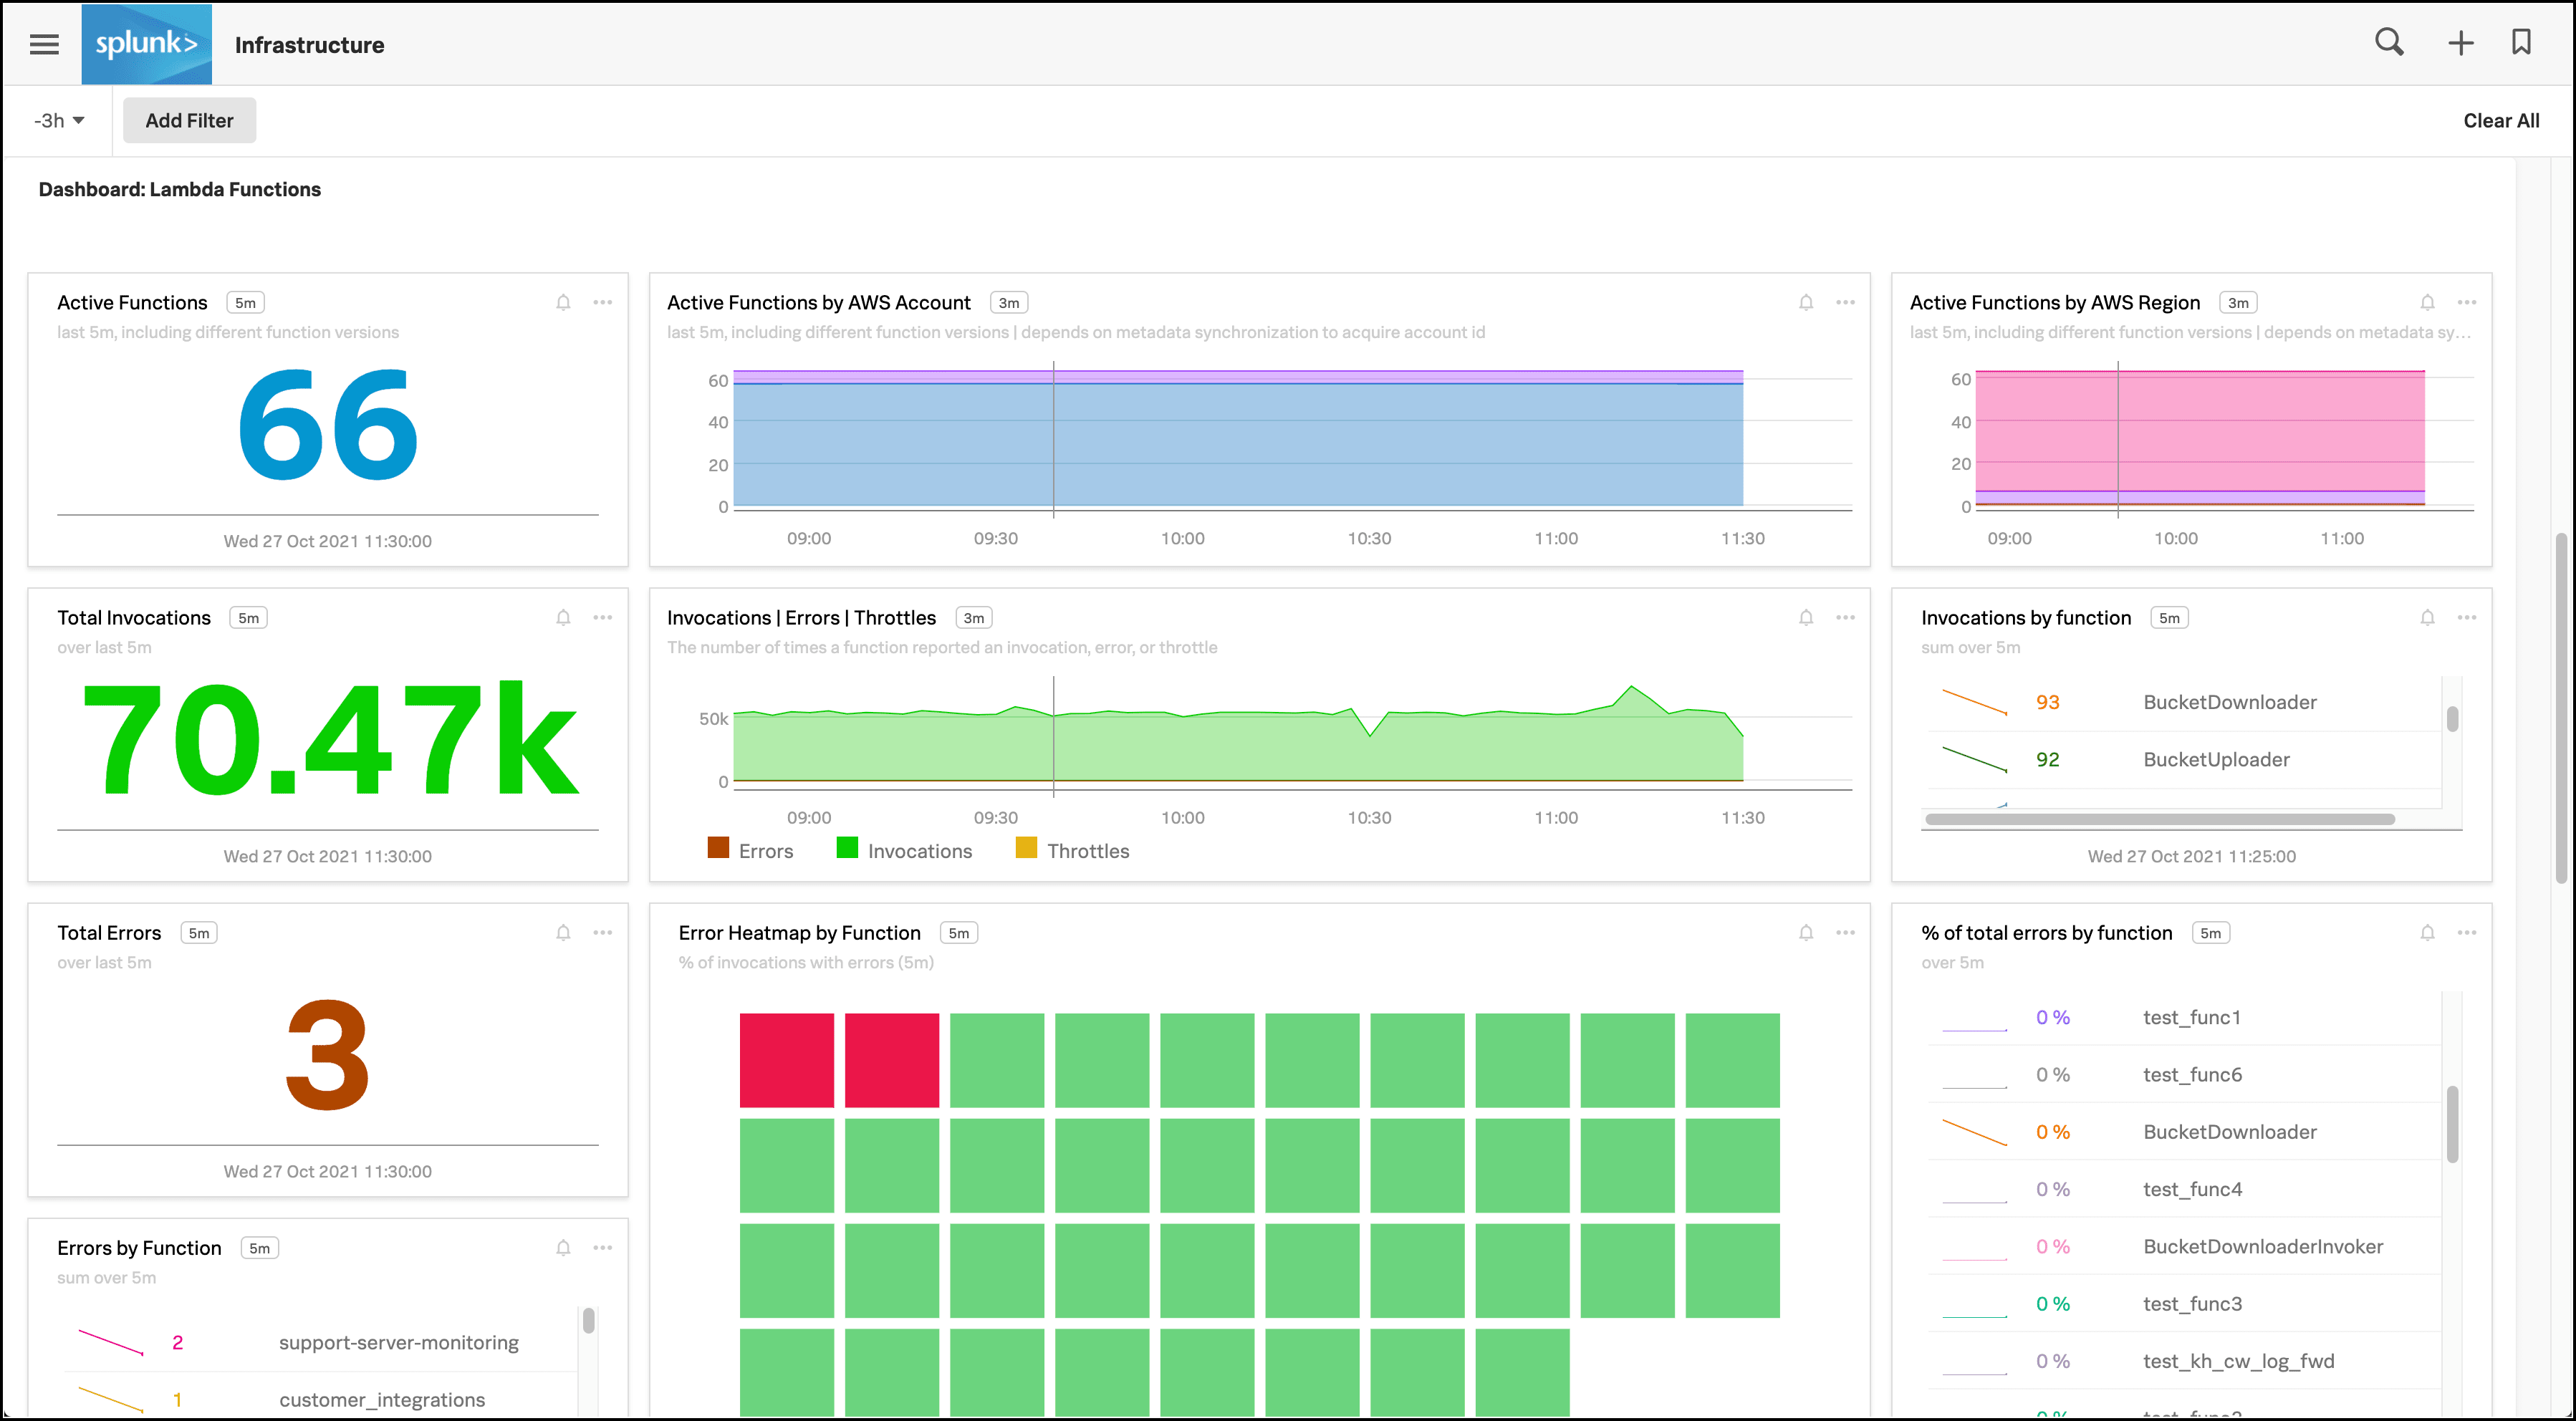
View metrics in built-in dashboards for AWS Lambda 🔗
Splunk Observability Cloud uses built-in dashboards to display charts and visualizations of your AWS Lambda data.
To use built-in dashboards, see Built-in dashboards.
Search for metrics using the metric finder 🔗
You can search for your serverless function metrics using the Splunk metric finder. To learn more, see Search for metrics in the Metric Finder.
Next steps 🔗
Optionally, identify whether your applications and functions use any custom data points and send them to Splunk Observability Cloud. See Part 3: Configure applications and serverless functions to send custom data.