Part 3: Configure applications and serverless functions to send custom data 🔗
Now that you have built-in data from your full stack flowing into Splunk Observability Cloud, assess whether there are custom data points you need to bring in.
For many teams, some of the most meaningful data is custom data because you can define these data points to focus on what is most important to you in your specific environment.
For example, if you run an ecommerce site, you might configure your application to send a custom metric about the number of orders placed. You can then create a detector to receive an alert when the number of orders drops significantly. You can also configure your application to send a custom metric about how long payment processing takes. You can then create a detector to issue alerts when the processing time exceeds a threshold.
Configure back-end applications to send custom data 🔗
Splunk has client libraries for several types of applications. By instrumenting your code with these libraries, you can send custom data to Splunk Observability Cloud.
Use the library for your application language:
Go client library for SignalFx on GitHub
For Java, use one of these available integrations:
Node.js client library for SignalFx on GitHub
Python client library for SignalFx on GitHub
Configure serverless functions to send custom data 🔗
To instrument your AWS Lambda serverless functions, see Instrument serverless functions for Splunk Observability Cloud.
Use Splunk Observability Cloud to access your custom data 🔗
Access your custom data in the following locations:
The Splunk APM landing page
Splunk APM explorer view
Splunk metric finder
View traces on the APM landing page 🔗
The Splunk APM landing page shows a preview of your custom trace data. To learn how to access the APM landing page, see Assess the health of your applications with the APM landing page.
View traces in the APM Explorer view 🔗
The Splunk APM explorer view shows detailed information about your trace data, such as dependencies among your applications. To learn more, see View dependencies among your services in the service map.
Search for metrics using the metric finder 🔗
You can use the Splunk metric finder to search for your custom metrics.
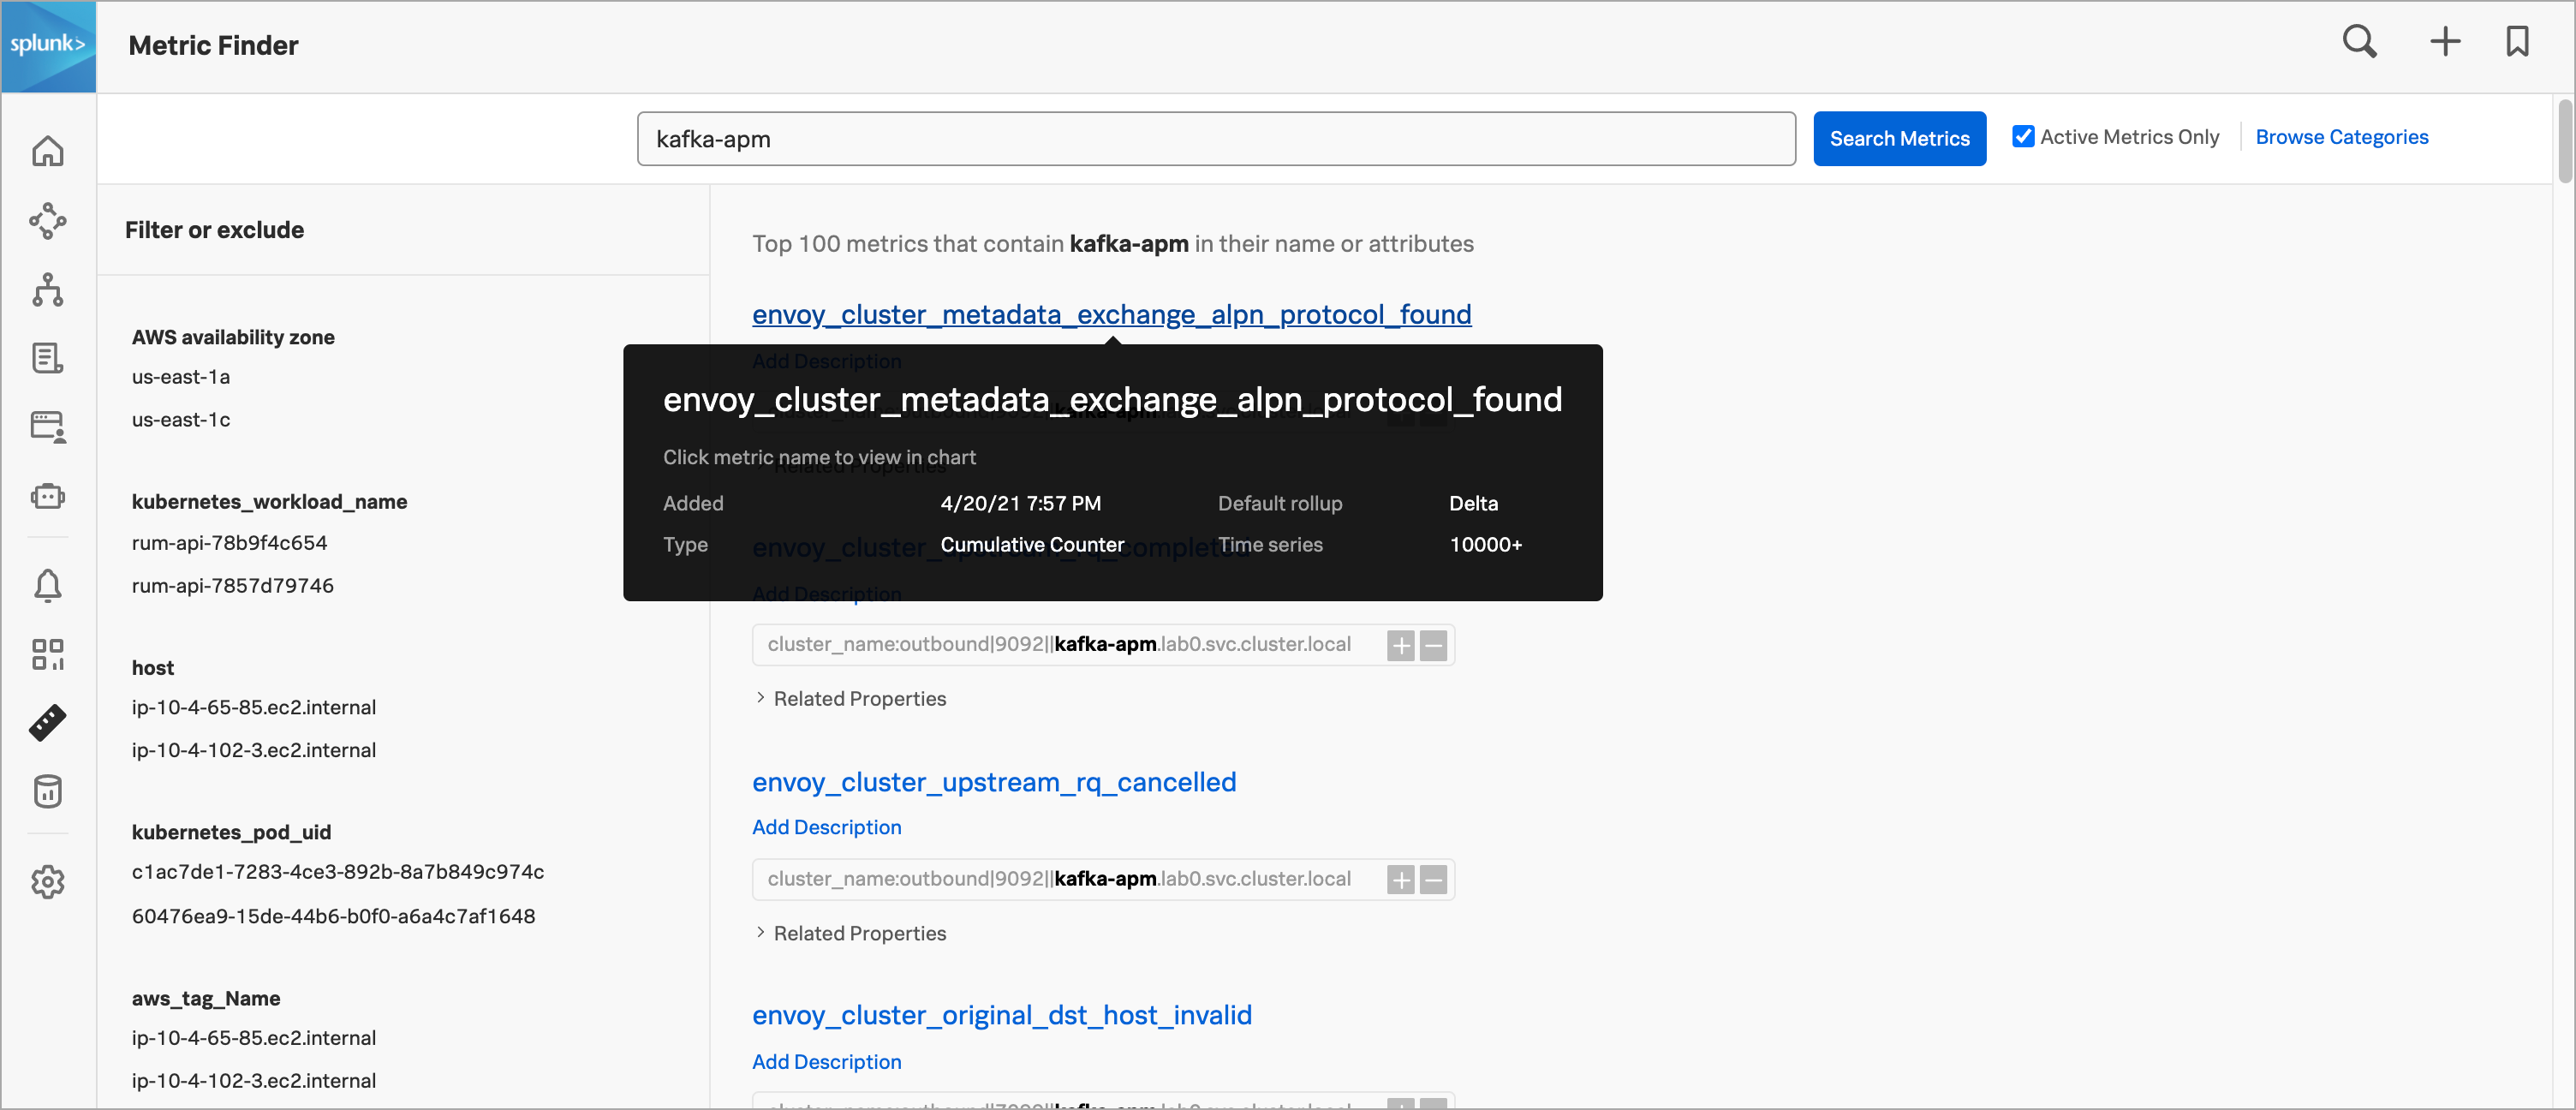
For more information, see Search for metrics in the Metric Finder.