Part 1: Configure your infrastructure and cloud services to send data to Splunk Observability Cloud 🔗
If you’re using cloud services such as AWS, GCP, and Azure for your infrastructure, integrate these services with Splunk Observability Cloud.

With cloud service integrations, you can send metrics and metadata (such as tags, labels and other properties) to Splunk Infrastructure Monitoring, giving you a detailed analysis of your cloud service data.
Choose a method for cloud service integration 🔗
You can integrate your cloud service in a variety of methods. By default, each cloud service integration has an associated setup guide in Splunk Observability Cloud.
You might choose a different method depending on your preferences or your current setup. For example, if you’re setting up a small number of integrations, use the guided setup. If you’re setting up many integrations for different accounts and regions, use the API or Terraform.
To get started, choose your preferred method from the table of methods for your cloud service provider and follow the associated instructions for setup.
Amazon Web Services 🔗
Splunk supports the following integration methods for AWS:
Method |
Description |
Instructions |
|---|---|---|
Polling (default) |
Polls AWS CloudWatch for metrics at a specified rate. To configure, use the Splunk Observability Cloud guided setup or the Splunk API. |
|
Streaming (Splunk-managed) |
Collects and manage metric streams from AWS. To configure, use the Splunk Observability Cloud guided setup or the Splunk API. |
|
Streaming (AWS-managed) |
Collects and manage metric streams from AWS. To configure, use the AWS console. |
Connect Splunk Observability Cloud with AWS-managed Metric Streams |
Splunk Terraform |
Connect to AWS by configuring and deploying an integration through Terraform. |
Google Cloud Platform 🔗
Splunk supports the following integration methods for GCP:
Method |
Description |
Instructions |
|---|---|---|
Guided setup (default) |
Connect to GCP using the guided setup in Splunk Observability Cloud. |
|
Splunk API |
Connect to GCP using the Splunk Observability Cloud API. |
Integrate Google Cloud Platform Monitoring with Splunk Observability Cloud |
Terraform |
Connect to GCP by configuring and deploying an integration through Terraform. |
Microsoft Azure 🔗
Splunk supports the following integration methods for Azure:
Method |
Description |
Instructions |
|---|---|---|
Guided setup (default) |
Connect to Azure using the guided setup in Splunk Observability Cloud. |
|
Splunk API |
Connect to Azure using the Splunk Observability Cloud API. |
Integrate Microsoft Azure Monitoring with Splunk Observability Cloud |
Terraform |
Connect to Azure by configuring and deploying an integration through Terraform. |
Access your cloud service data in Splunk Observability Cloud 🔗
After you’ve integrated your cloud services with Splunk Observability Cloud, you can use the following methods to access your data:
If you can see your data in navigators, dashboards, or in the metric finder, then your integration is working.
View metrics in Infrastructure Monitoring navigators 🔗
Splunk Observability Cloud uses navigators to display visualizations of your data.
For example, the following AWS ELB navigator shows heat maps and charts with load balancer data.

For more information about monitoring your cloud services with navigators, see the following guides:
View metrics in built-in dashboards for cloud services 🔗
Splunk Observability Cloud provides built-in dashboards that display important data visualizations related to your cloud services.
For example, the “AWS EC2” built-in dashboard group contains dashboards with visualizations of EC2 data:
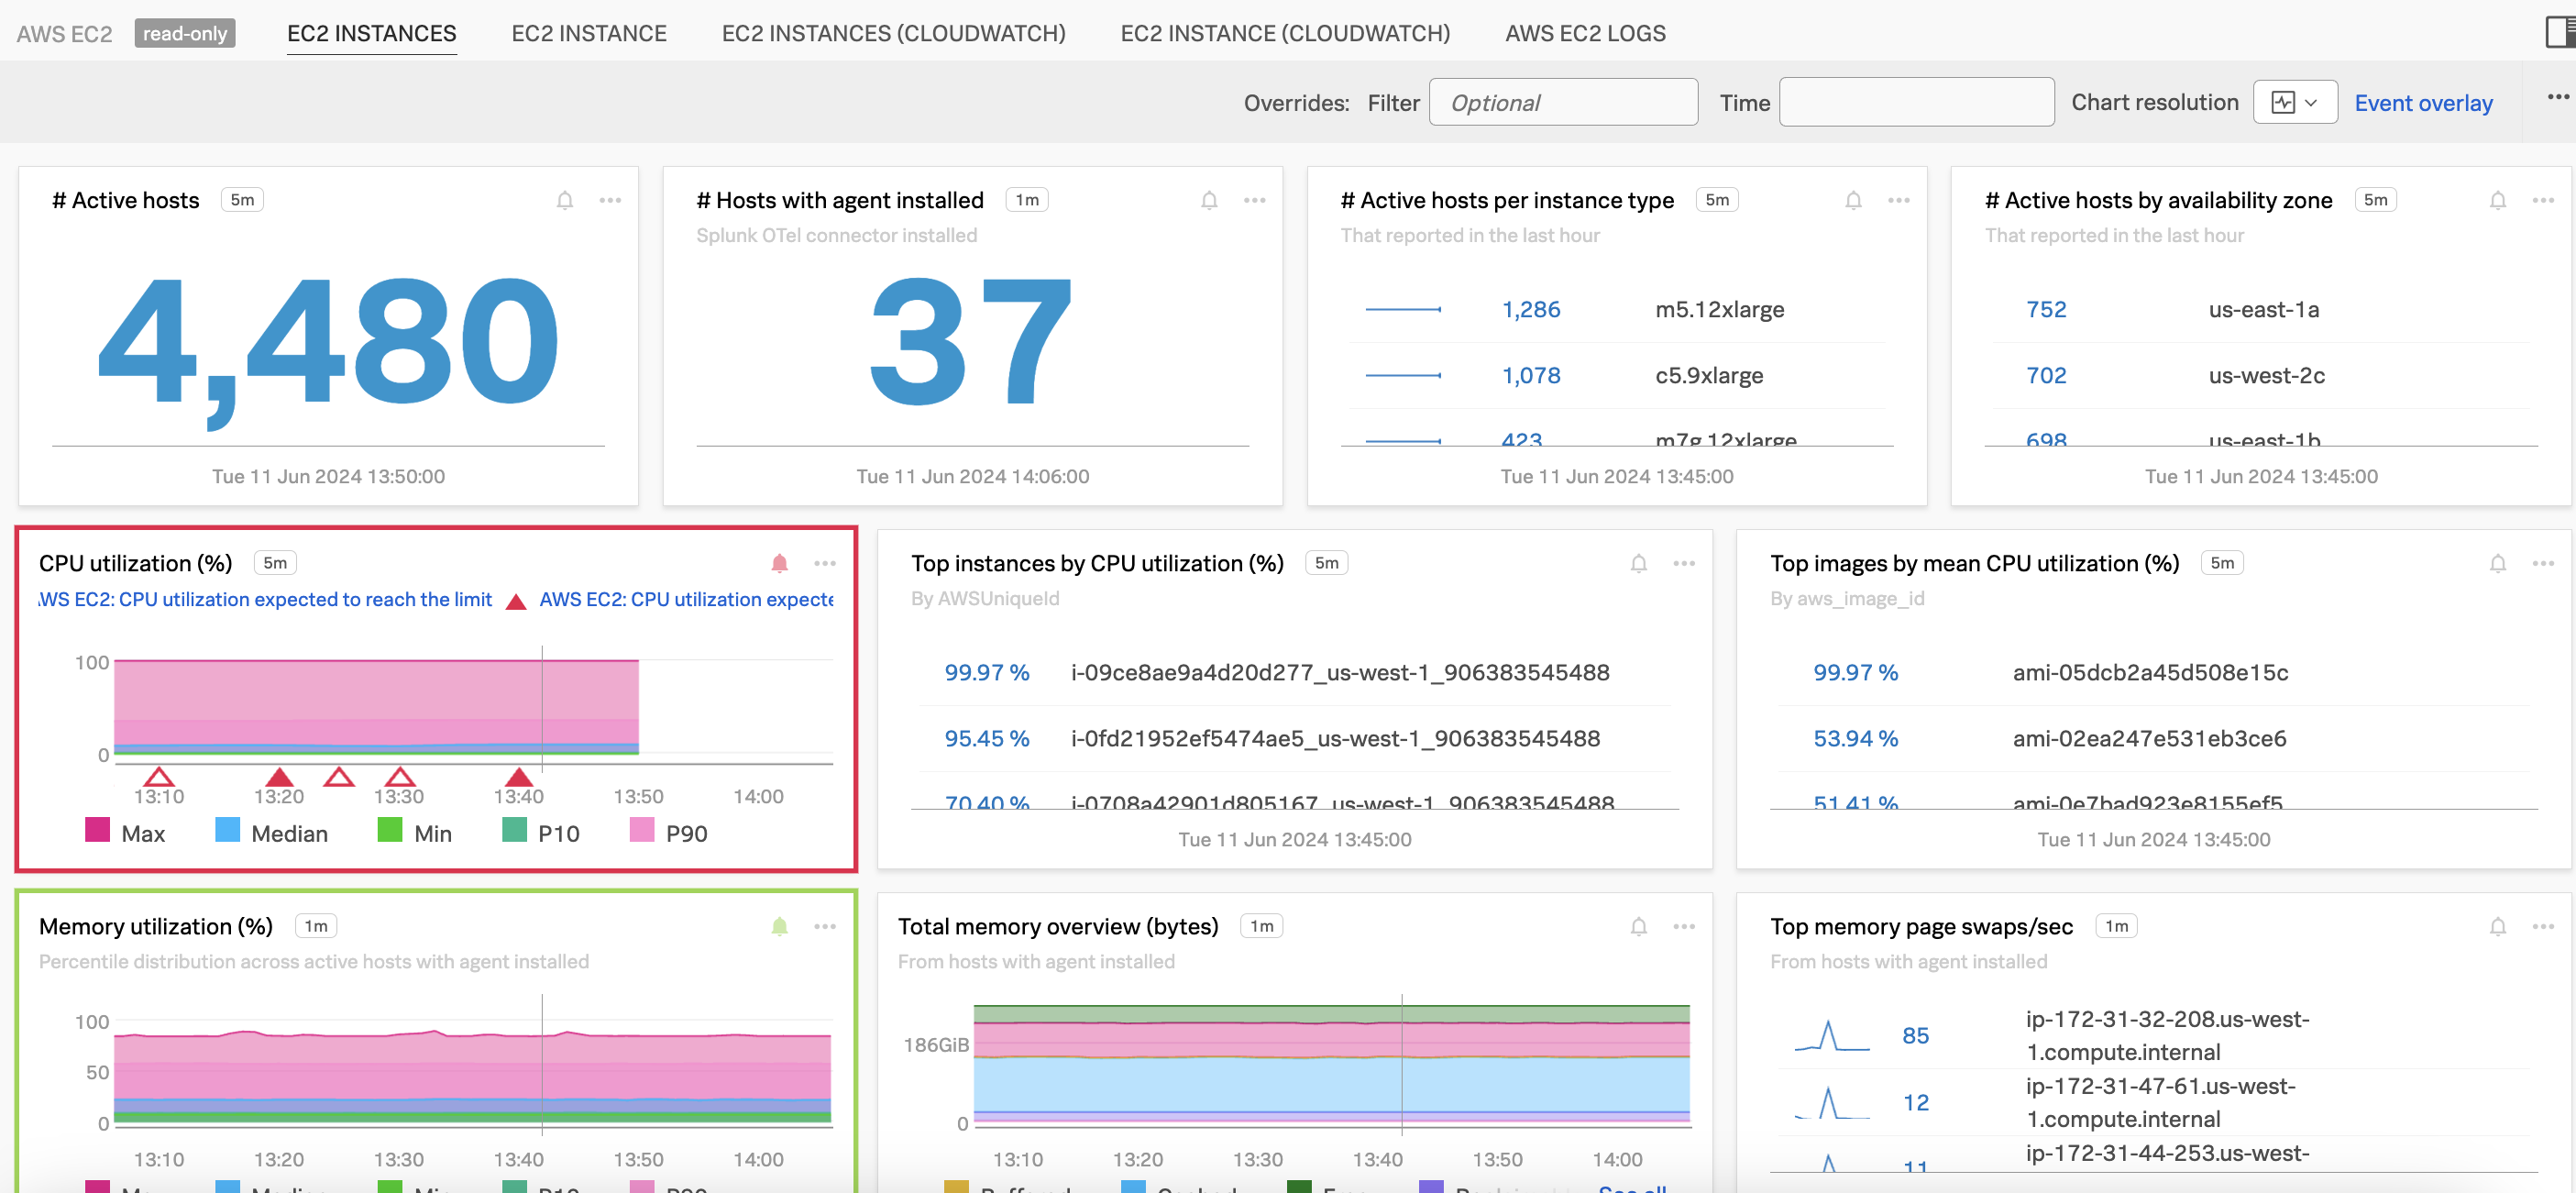
To learn how to use built-in dashboards to monitor your cloud services, see View metrics in built-in dashboards for cloud services.
Search for metrics using the metric finder 🔗
You can use the metric finder to search for your cloud service metrics. To learn more, see Search for metrics in the Metric Finder.
For lists of metrics provided by each cloud service, see the following:
Next steps 🔗
To continue setting up your infrastructure for Splunk Observability Cloud, see Part 2: Install the OpenTelemetry Collector to send server and cluster data.