Monitor Amazon Web Services 🔗
Splunk Observability Cloud’s Infrastructure Monitoring imports data, logs, and metadata, including tags and other properties, for the following AWS services.
To monitor AWS resources:
Set up the Splunk Observability Cloud AWS integration. To learn more see Connect AWS to Splunk Observability Cloud.
Next, learn how to monitor AWS with Splunk Observability Cloud.
Finally, check Costs for AWS monitoring.
Refer to the AWS official documentation for a list of the available AWS metrics and other data, or see the metadata Observablity Cloud provides.
See the AWS official documentation for a list of the available AWS metrics and other data, or see the metadatada Splunk Observability Cloud provides for AWS.
By default, Splunk Observability Cloud brings in data from all supported AWS services associated with your account, with certain limitations. To manage the amount of data to import, see Manage Amazon Web Services data import.
The AWS instance ID is not a unique identifier. To uniquely identify an AWS instance, you need to concatenate the instanceId, region, and accountID dimension values, separated by underscores “_”, as in instanceId_region_accountID.
To construct the identifier manually, first get the specified values for each of your instances. For example, you can
use the following cURL command:
curl http://<INSTANCE_URL>/latest/dynamic/instance-identity/document
Here’s an example JSON response from the cURL command:
{
   "devpayProductCodes" : null,
   "privateIp" : "10.1.15.204",
   "availabilityZone" : "us-east-1a",
   "version" : "2010-08-31",
   "accountId" : "134183635603",
   "instanceId" : "i-a99f9802",
   "billingProducts" : null,
   "instanceType" : "c3.2xlarge",
   "pendingTime" : "2015-09-02T16:45:40Z",
   "imageId" : "ami-2ef44746",
   "kernelId" : null,
   "ramdiskId" : null,
   "architecture" : "x86_64",
   "region" : "us-east-1"
}
From the response, copy the values for instanceId, region, and accountId. Concatenate them with
underscores as separators, and use the resulting string identifier as the value for the sfxdim\_AWSUniqueId dimension.
Infrastructure Monitoring also sends a set of metrics for AWS related to errors and service calls for your organization. These metrics all start with sf.org.num.aws. For more information, see View organization metrics for Splunk Observability Cloud.
You can also use the Splunk Distribution of the OpenTelemetry Collector to import AWS metrics and metadata. The Collector offers much more customization than you have available with the AWS integration, so you might want to use it when you want to see metrics at a finer resolution or when you need more control over the metrics you import.
You can only use the Collector when you have direct control over the applications installed on an AWS instance, such as AWS Elastic Compute Cloud (EC2). Some other AWS services require you to use Infrastructure Monitoring AWS integration and AWS CloudWatch. As a result, you might need to use both the AWS integration and OTel.
To learn more, see Get started with the Splunk Distribution of the OpenTelemetry Collector.
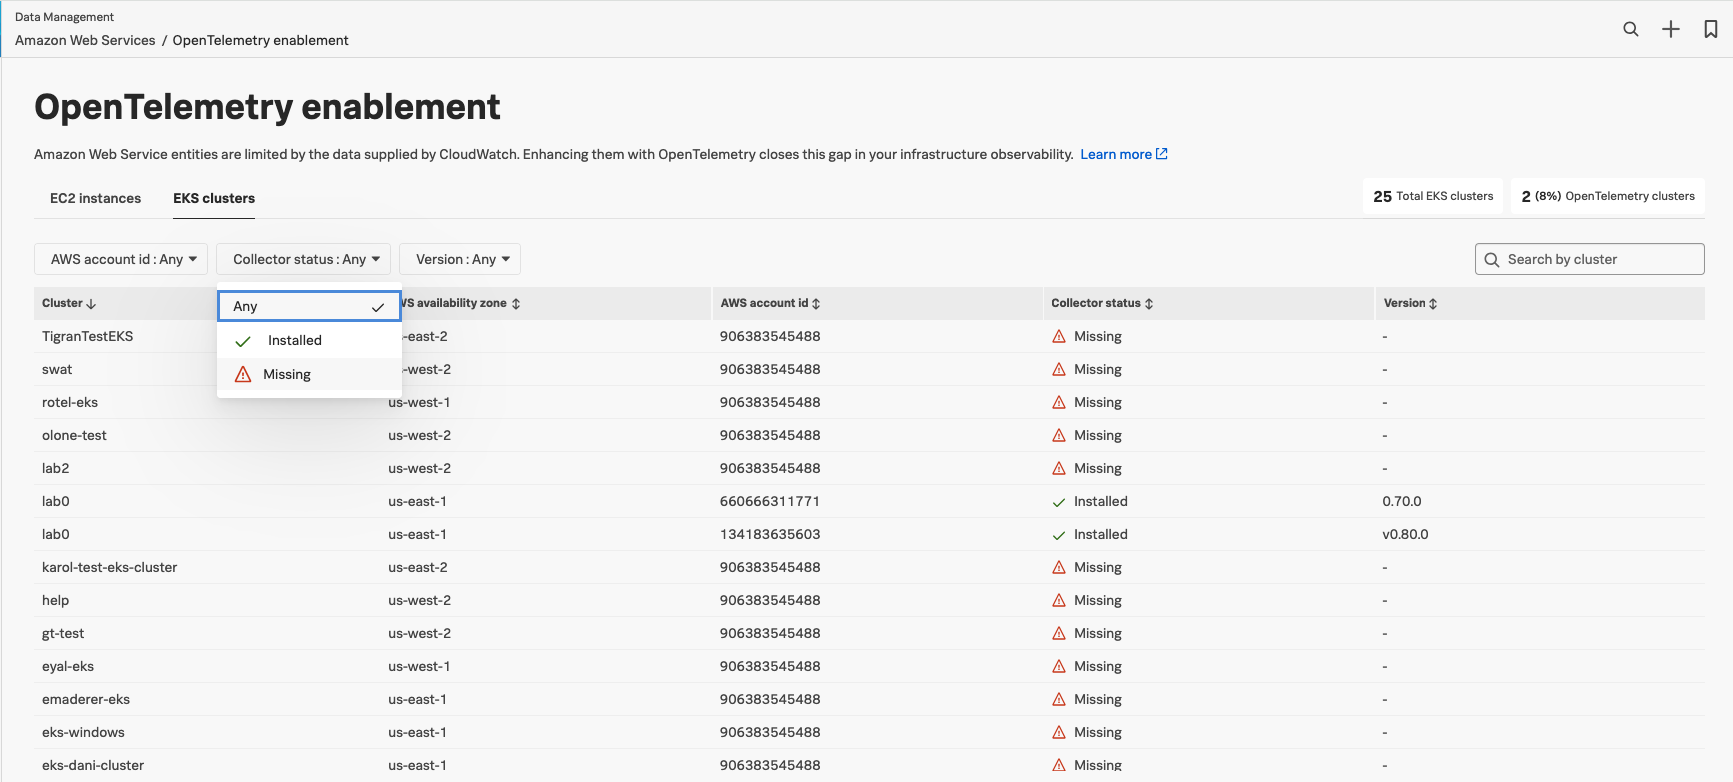
To track the degree of OpenTelemetry enablement in your AWS integrations:
From Splunk Observability Cloud, go to Data Management > Deployed integrations > AWS.
Select either the AWS EC2 or AWS EKS tabs to see whether the OTel Collector is installed on each AWS EC2 instance or AWS EKS cluster. This helps you identify the instances that still need to be instrumented.
For OTel Collector instances that are successfully instrumented, you can see which version of the Collector is deployed.