Manage Amazon Web Services data import 🔗
Note
To set up your AWS integration see Connect AWS to Splunk Observability Cloud.
To understand the costs associated to working with AWS data in Splunk Observability Cloud see Costs for AWS monitoring.
Splunk Observability Cloud’s Amazon Web Services (AWS) integration imports metrics and metadata from AWS CloudWatch and the following AWS services, as well as other applications.
After you’ve sent your AWS data, Splunk Observability Cloud helps you monitor your AWS resources and the applications that are using those resources. See how at Monitor Amazon Web Services.
Import AWS CloudWatch data and metadata 🔗
AWS provides a CloudWatch agent that lets you import metrics, logs, and metadata. Metrics are data points identified by a name, and metadata is information that helps you identify aspects of the metrics such as its source. AWS metrics and metadata help you monitor and troubleshoot the AWS services you’re using. They also help you monitor applications, such as Kubernetes clusters, that use the AWS services. See more at Monitor Amazon Web Services.
By default, Splunk Observability Cloud brings in data from all supported AWS services associated with your account, with certain limitations.
AWS data in Splunk Observability Cloud 🔗
During import, Splunk Observability Cloud gives metrics special names so you can identify them as coming from AWS:
AWS metadata becomes dimensions and custom properties.
AWS tags are key-value pairs, so Infrastructure Monitoring converts them into custom properties.
Splunk Observability Cloud adds the prefix aws_tag_ to the names of tags imported from AWS, which indicates their origin. For example, the AWS tag version:canary is converted to aws_tag_version:canary.
Caution
For target groups Splunk Observability Cloud adds the prefix aws_tag_tg_ to avoid conflicts with load balancer tags.
To learn more, see Metadata available per service, or refer to the AWS documentation site.
Namespaces in Splunk Observability Cloud 🔗
Splunk Observability Cloud imports metadata using the dimension namespace. For most AWS services, the namespace name has the form "AWS/<NAME_OF_SERVICE>", such as “AWS/EC2” or “AWS/ELB”. To select a metric time series (MTS) for an AWS metric when the metric has the same name for more than one service, such as CPUUtilization, use the namespace dimension as a filter.
To control the amount of data you import, you can specify the namespaces you want to import data from, add any AWS CloudWatch agent namespace as a custom namespace, or select the data you want to import or exclude from each namespace. For more information, see Control the data and metadata to import.
CloudWatch rollups and Infrastructure Monitoring MTS 🔗
AWS CloudWatch uses rollups to summarize metrics, and it refers to them as “statistics”. To learn more about rollups, see Rollups in data resolution and rollups in charts.
Because AWS CloudWatch rollups don’t map directly to Infrastructure Monitoring rollups, you can’t directly access AWS CloudWatch rollups using the rollup selection menu in the Chart Builder. Instead, Infrastructure Monitoring captures the rollups as individual MTS that have the dimension stat.
AWS statistic |
IM dimension |
Definition |
|---|---|---|
Average |
stat:mean |
Mean value of metric over the sampling period |
Maximum |
stat:upper |
Maximum value of metric over the sampling period |
Minimum |
stat:lower |
Minimum value of metric over the sampling period |
Data Samples |
stat:count |
Number of samples over the sampling period |
Sum |
stat:sum |
Sum of all values that occurred over the sampling period |
To use an AWS CloudWatch metric in a plot, always specify the following:
AWS Cloudwatch metric name
Filter for the
statdimension value that’s appropriate for the metric you’ve chosen.
For example, if you are using the metric NetworkPacketsIn for EC2 metrics,
the only meaningful AWS statistics are Minimum, Maximum and Average. To plot NetworkPacketsIn metric with
the rollup you want, filter for the stat dimension with a value that corresponds to the AWS statistic (rollup) value:
lower: Rollup that corresponds to the AWS rollupMinimumupper: Rollup that corresponds to the AWS rollupMaximummean: Rollup that corresponds to the AWS rollupAverage
Note
The “Rollup: Multiple” label in a plot for a CloudWatch metric indicates that you haven’t specified the rollup you want. To avoid confusion, specify the rollup as soon as possible.
Infrastructure Monitoring uses a 60-second sampling period for metrics it imports from AWS.
To learn more, see the AWS developer documentation for AWS CloudWatch.
Import data and metadata from other applications 🔗
Splunk Observability Cloud also imports metrics, metadata, and logs for some of your applications that use AWS services, such as:
Get data in |
Monitor |
Description |
|---|---|---|
Import metrics and logs from Kubernetes clusters running in EC2 instances or EKS. |
||
Import metrics and logs from Linux and Windows hosts running in EC2 instances. |
||
Instrument back-end applications to send spans to Splunk APM |
Import application metrics and spans running in hosts, Kubernetes clusters, or Lambda functions. |
Control the data and metadata to import 🔗
By default, Splunk Observability Cloud imports metrics from all built-in AWS namespaces, corresponding to these AWS services. Optionally, you can add custom namespaces.
You can control data import with the following options:
Region
Namespaces
Polling rate (not available for data streaming)
Filtering
Control data import using namespaces 🔗
To limit the amount of AWS data to import, reduce the number of namespaces (services) to pull data from:
Specify a subset of built-in namespaces to import data from. On the UI, go to Select built-in services to collect data from, then choose the specific namespaces you want to work with. You can specify multiple built-in services.
Specify the custom namespaces to import data from. On the UI, go to Select custom services to collect data from, type the name of the custom namespace, then press Enter. Using this procedure, you can specify multiple custom namespaces. Note that data from built-in services is imported as well.
To discard data from built-in namespaces and only import metrics from custom namespaces, use the field
syncCustomNamespacesOnlyvia the API. See how to do this in our developer portal .
Control data import using the poll rate 🔗
You can also limit the amount of AWS data that the integration imports by changing the rate at which Infrastructure Monitoring polls AWS CloudWatch.
Control data import using filters 🔗
You can specify filters to limit the data you want to import for a specific namespace. Filters don’t affect tag syncing.
If you’re polling AWS data, you can filter built-in services with synced metadata based on AWS tags, metric names, or dimensions. Filters can either be inclusive or exclusive.
If you’re streaming AWS data, you can filter built-in services with synced metadata by metric name and dimensions. You can only use inclusive filters. Tag filtering is not available.
For services without metadata (including custom namespaces), you can only filter by metric names.
See how to filter data at Data import management examples.
Note
You must be an Administrator of your AWS account to specify namespaces and set filters.
Advanced filtering using the API 🔗
You can specify more complex filtering options for a namespace by using the Infrastructure Monitoring API. In this case, the UI displays a message indicating that the filter is defined programmatically.
To see which metrics and tags are included or excluded for that namespace, click View filter code.
Data import management examples 🔗
Example: Specify namespaces and filters 🔗
The following example demonstrates how to specify the following:
Namespace: Only import data from Amazon Elasticsearch Service and EC2.
Data filters: Only import data from EC2 if it matches a filter.
Tag filters: Exclude data from resources that have the AWS tag
version:canary.
To create these specifications, follow these steps:
From the list of namespaces, select Amazon Elasticsearch Service and EC2.
To limit the data Infrastructure Monitoring imports from EC2, select data filters from the list.
To select the filters you want from the following options:
Use Import some if you want a filter that only imports data.
Use Exclude some if you want a filter that only excludes data.
To use AWS tags to limit the data Infrastructure Monitoring imports, filter by tag. For this example, specify a filter that excludes data from resources that have the AWS tag
version:canary. Infrastructure Monitoring adds the prefixaws_tag_to the names of tags imported from AWS, which indicates their origin. For example, the AWS tagversion:canaryappears in Infrastructure Monitoring asaws_tag_version:canary. When you filter an AWS integration by tag, enter the name of the tag as it appears in AWS.
You can also choose specific metrics to include or exclude. For example, consider the following conditions.
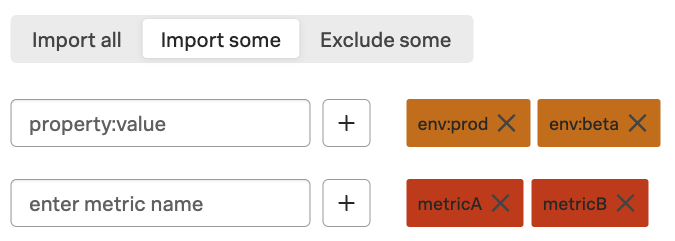
Infrastructure Monitoring only includes metricA and metricB, and only for resources specified by the tags:
For a resource that has the tag
env:prodorenv:beta, metricA and metricB are included.For a resource that doesn’t have the tags
env:prodorenv:beta, no metrics are included.No other metrics are included.
Infrastructure Monitoring supports wildcards in filters. For example, if you want to import data for a resource that has specific tags, regardless of the tag values, specify this filter:
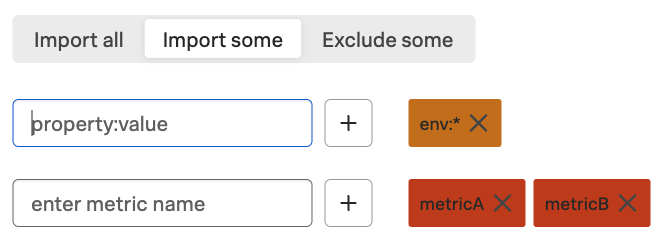
In this example, metricA and metricB are included for resources that have the env tag set to any value. No other metrics are included.
When you remove a namespace, Infrastructure Monitoring no longer includes metrics from that namespace.