Set up Log Observer Connect for Splunk Enterprise 🔗
Set up Log Observer Connect by integrating Log Observer with Splunk Enterprise. When you set up Log Observer Connect, Splunk Observability Cloud uses the Splunk Enterprise search head to authenticate the service account and to run searches.
If you are in a Splunk Cloud Platform environment and want to set up Log Observer Connect, see Set up Log Observer Connect for Splunk Cloud Platform.
When you set up Log Observer Connect, your Splunk Enterprise logs data remains in Splunk Enterprise. Log Observer Connect does not store or index your logs data. There is no additional charge for Log Observer Connect.
Note
You can collect data using both the Splunk Distribution of the OpenTelemetry Collector and the Universal Forwarder without submitting any duplicated telemetry data. See Use the Splunk Universal Forwarder with the Collector to learn how.
Region and version compatibility 🔗
Splunk Log Observer Connect is available in the AWS regions us0, us1, eu0, eu1, eu2, jp0, and au0, and in the GCP region us2. Splunk Log Observer Connect is compatible with Splunk Enterprise versions 9.0.1 and higher, and Splunk Cloud Platform versions 9.0.2209 and higher. Log Observer Connect is not available for Splunk Cloud Platform trials.
You cannot access logs from a GovCloud environment through Log Observer Connect. However, you can use global data links to link from Log Observer Connect to your GovCloud environment where you can access your logs. For more information on global data links, see Link metadata to related resources using global data links.
Prerequisites 🔗
To set up Log Observer Connect for Splunk Enterprise, you must have an administrator role in Splunk Observability Cloud. You must also be an administrator in Splunk Enterprise.
You need your service account username, password, Splunk platform URL (search head cluster), and a certificate.
Ensure the following configuration in your Splunk Enterprise instance:
Token authentication is active on your Log Observer Connect service account. See Securing Splunk Enterprise: Enable or disable token authentication to learn how.
Make sure you can access these IP addresses from the Splunk Enterprise host or network:
us0:
34.199.200.84,52.20.177.252,52.201.67.203,54.89.1.85us1:
44.230.152.35,44.231.27.66,44.225.234.52,44.230.82.104us2:
35.247.113.38/32,35.247.32.72/32,35.247.86.219/32eu0:
108.128.26.145,34.250.243.212,54.171.237.247eu1:
3.73.240.7,18.196.129.64,3.126.181.171eu2:
13.41.86.83,52.56.124.93,35.177.204.133jp0:
35.78.47.79,35.77.252.198,35.75.200.181au0:
13.54.193.47,13.55.9.109,54.153.190.59
Expose port
8089to all the IPs of the realms you’re using. Log Observer Connect needs to be able to access the search head on port8089. It doesn’t need to directly access the deployer or indexers. For example, if you have a search head cluster with load balancer in front of the members of the search head cluster, you allow the incoming traffic to the load balancer.
Caution
Check with your security team before you add these IPs to the allow list of your firewall rules or to your security groups in AWS.
Set up Log Observer Connect 🔗
To set up Log Observer Connect for Splunk Enterprise, follow these steps:
Splunk Observability Cloud 🔗
In Splunk Observability Cloud, do the following:
Go to Settings then :guilabel:` Log Observer Connect` and select Add new connection. If you don’t see Log Observer Connect in Settings, you are not an administrator in Splunk Observability Cloud. Contact your organization’s Splunk Observability Cloud administrator to perform this integration.
Select Splunk Enterprise. Next, log in to Splunk Enterprise as an administrator and follow the instructions in the next section.
Splunk Enterprise 🔗
You must create a user and role in your Splunk Enterprise search head to serve as a service account for Splunk Observability Cloud.
In your Splunk Enterprise search head, follow the instructions in the guided setup for the integration to do the following:
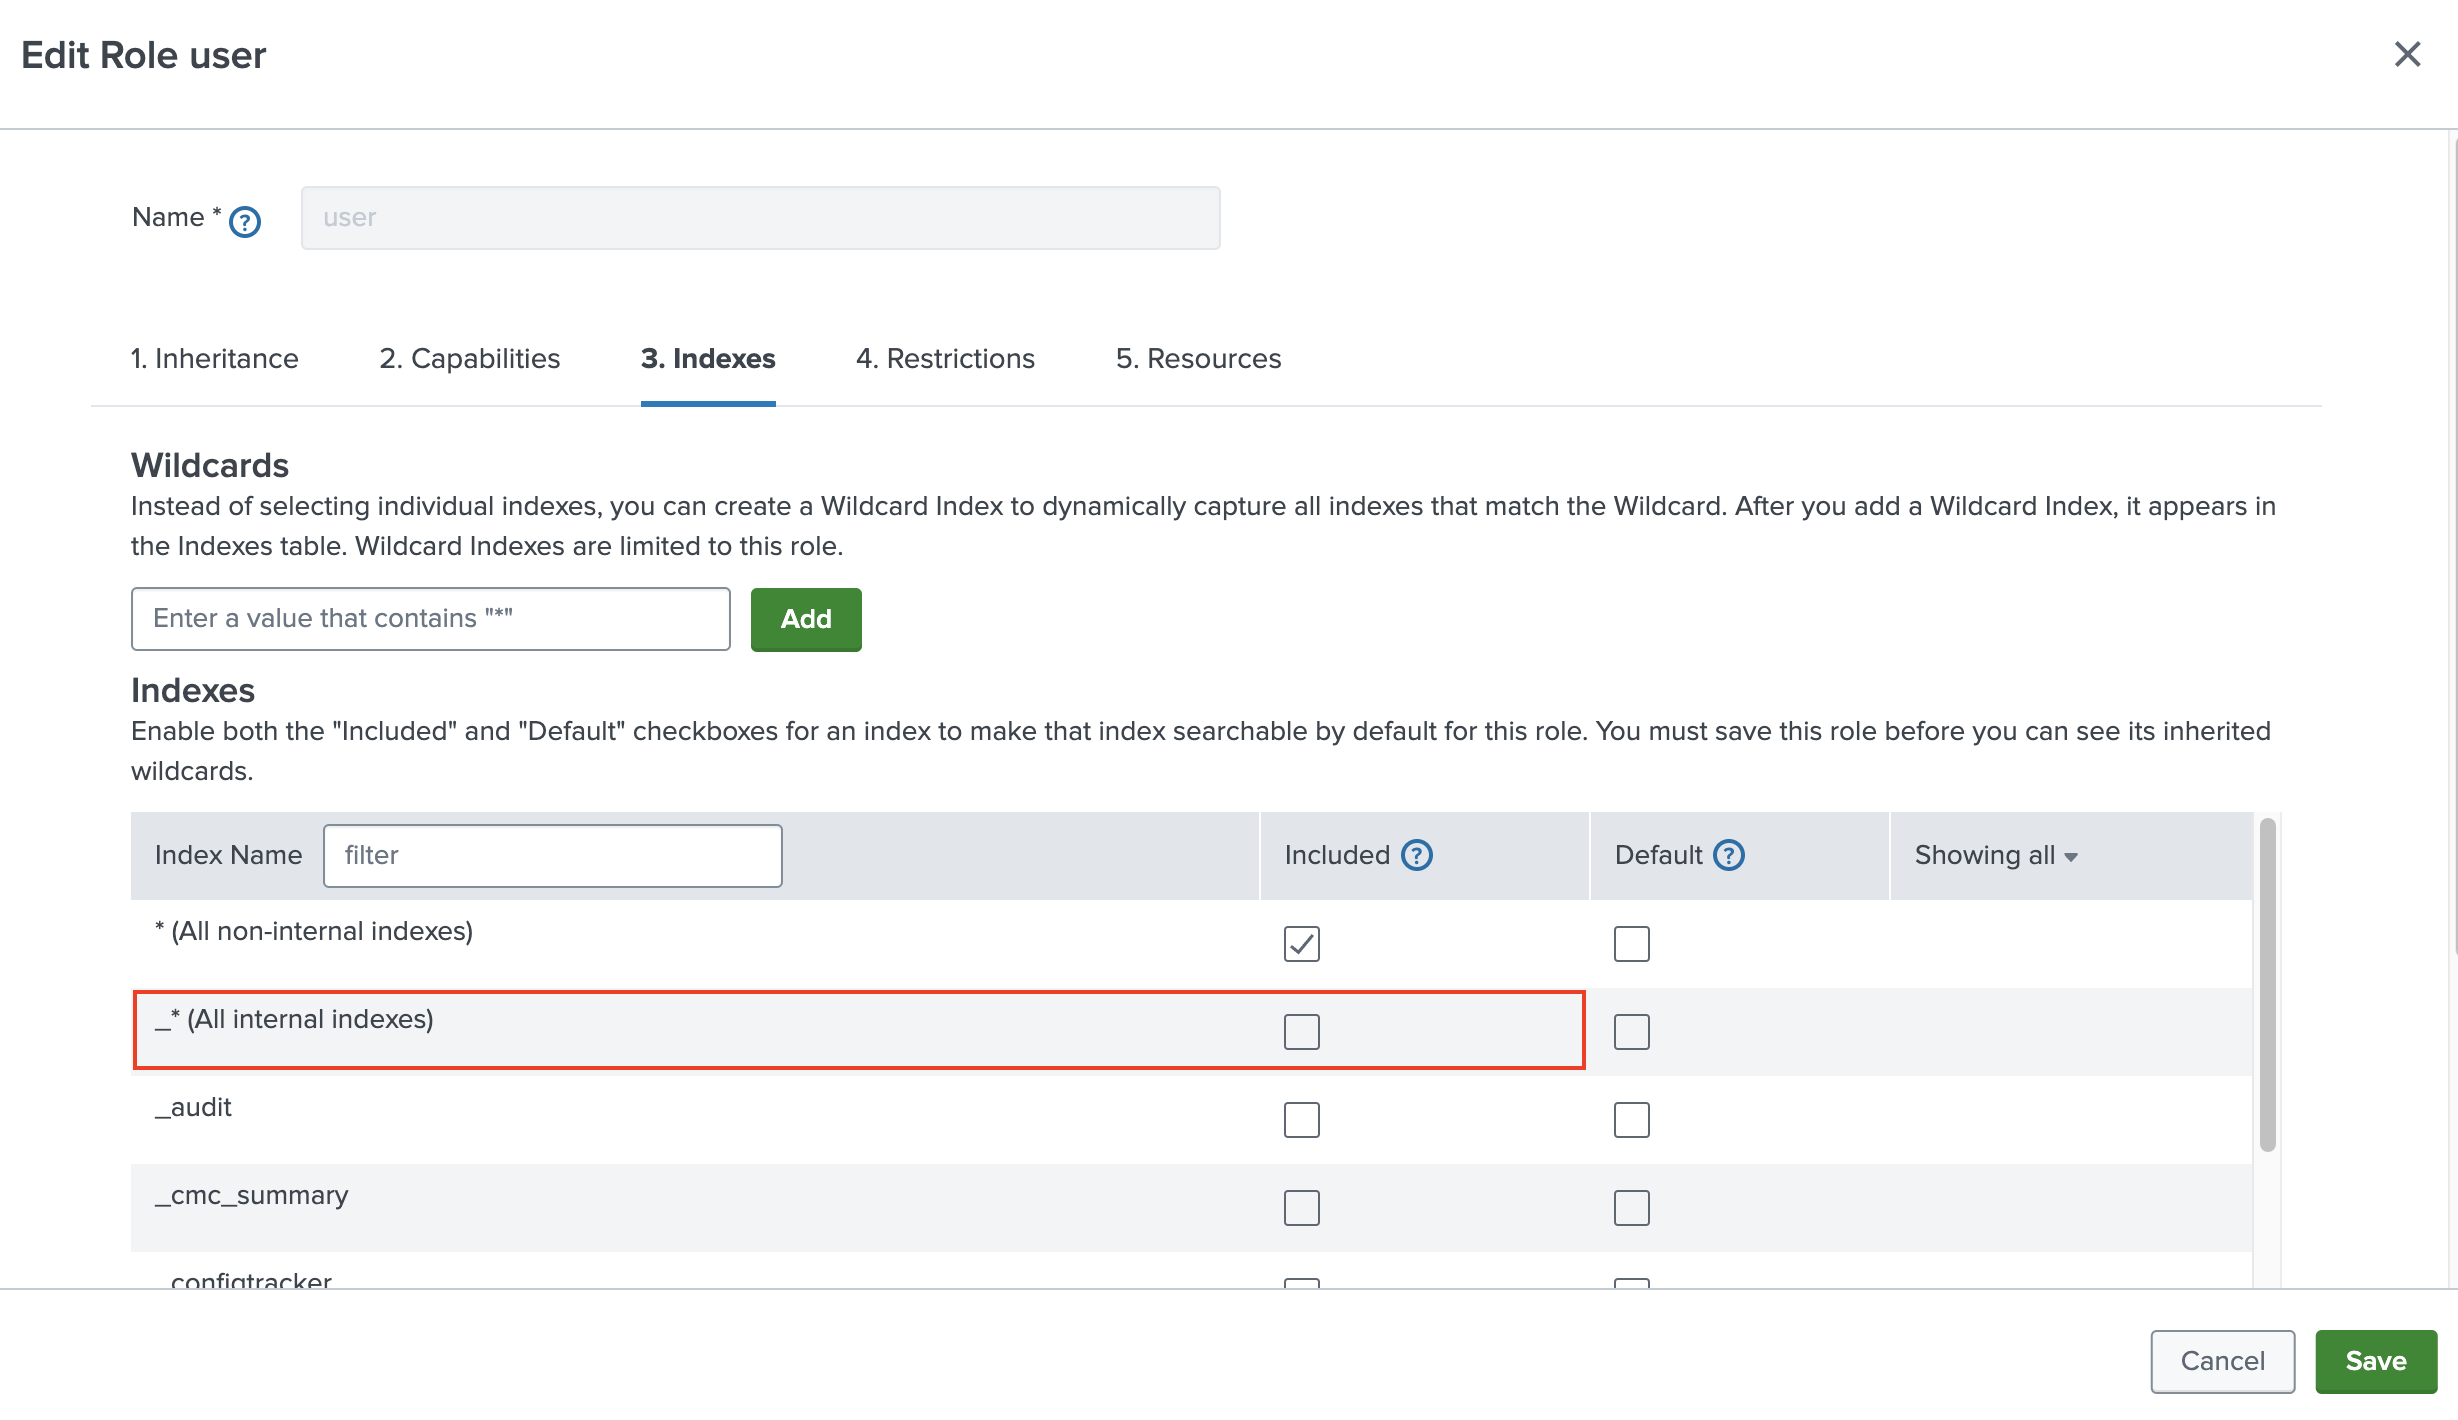
To set up a service account for Log Observer Connect, go to Settings then Roles. Select the role you want to use for the Log Observer Connect service account. The service account is a user role that can access the specific Splunk Enterprise indexes that you want your users to search in Log Observer Connect.
On the Indexes tab in the Included column, deselect *(All internal indexes) and select the indexes that you want users to query in Log Observer Connect.
On the Capabilities tab, ensure that
edit_tokens_ownandsearchare selected. Also, ensure thatindexes_list_allis not selected.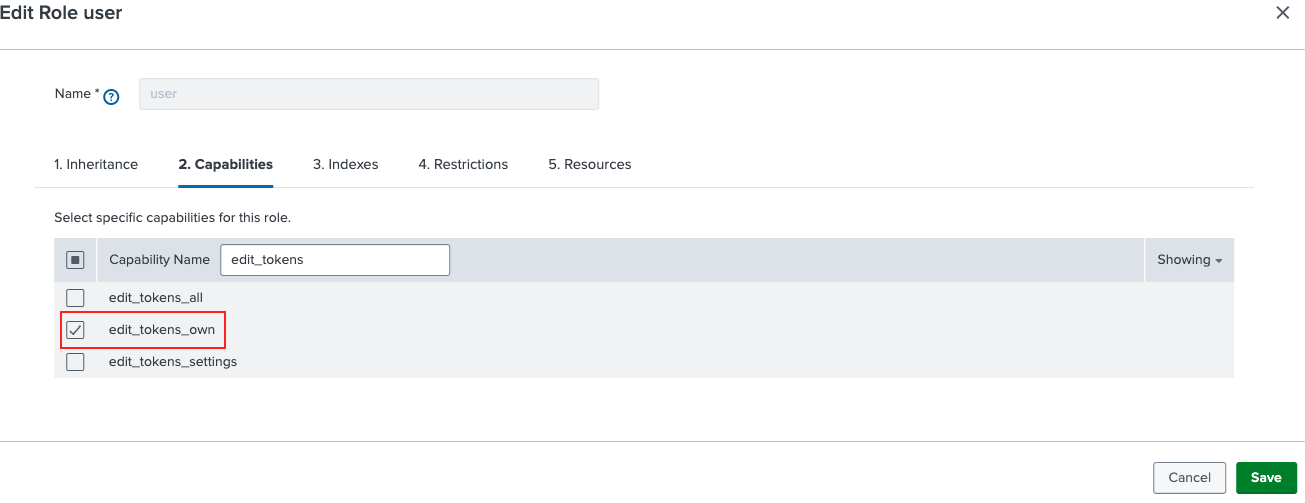
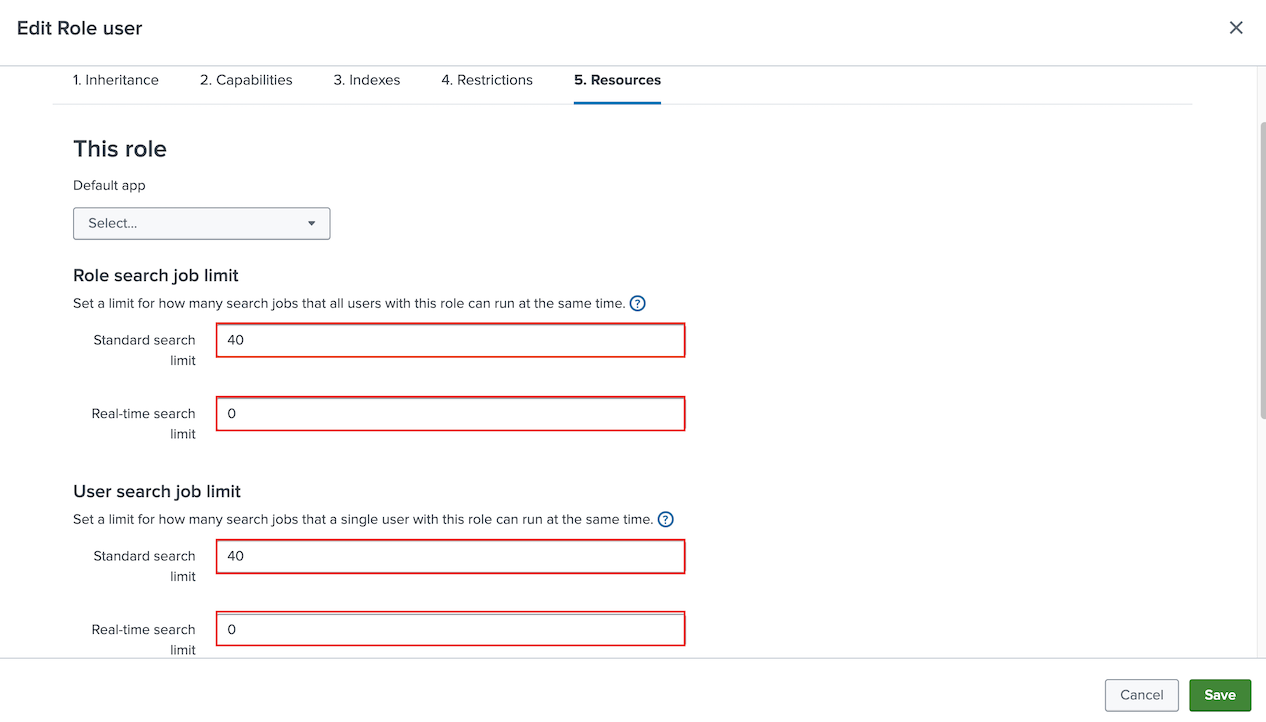
On the Resources tab, enter a Standard search limit of 40 for both Role search job limit and User search job limit. Enter 0 for Real-time search limit for both role and user search job limits.
The limit of 40 assumes that you have 10 Log Observer Connect users. To determine your ideal Standard search limit, multiply the number of Log Observer Connect users you have by 4. For example, if you have 20 Log Observer users, enter a Standard search limit of 80 for both Role search job limit and User search job limit.
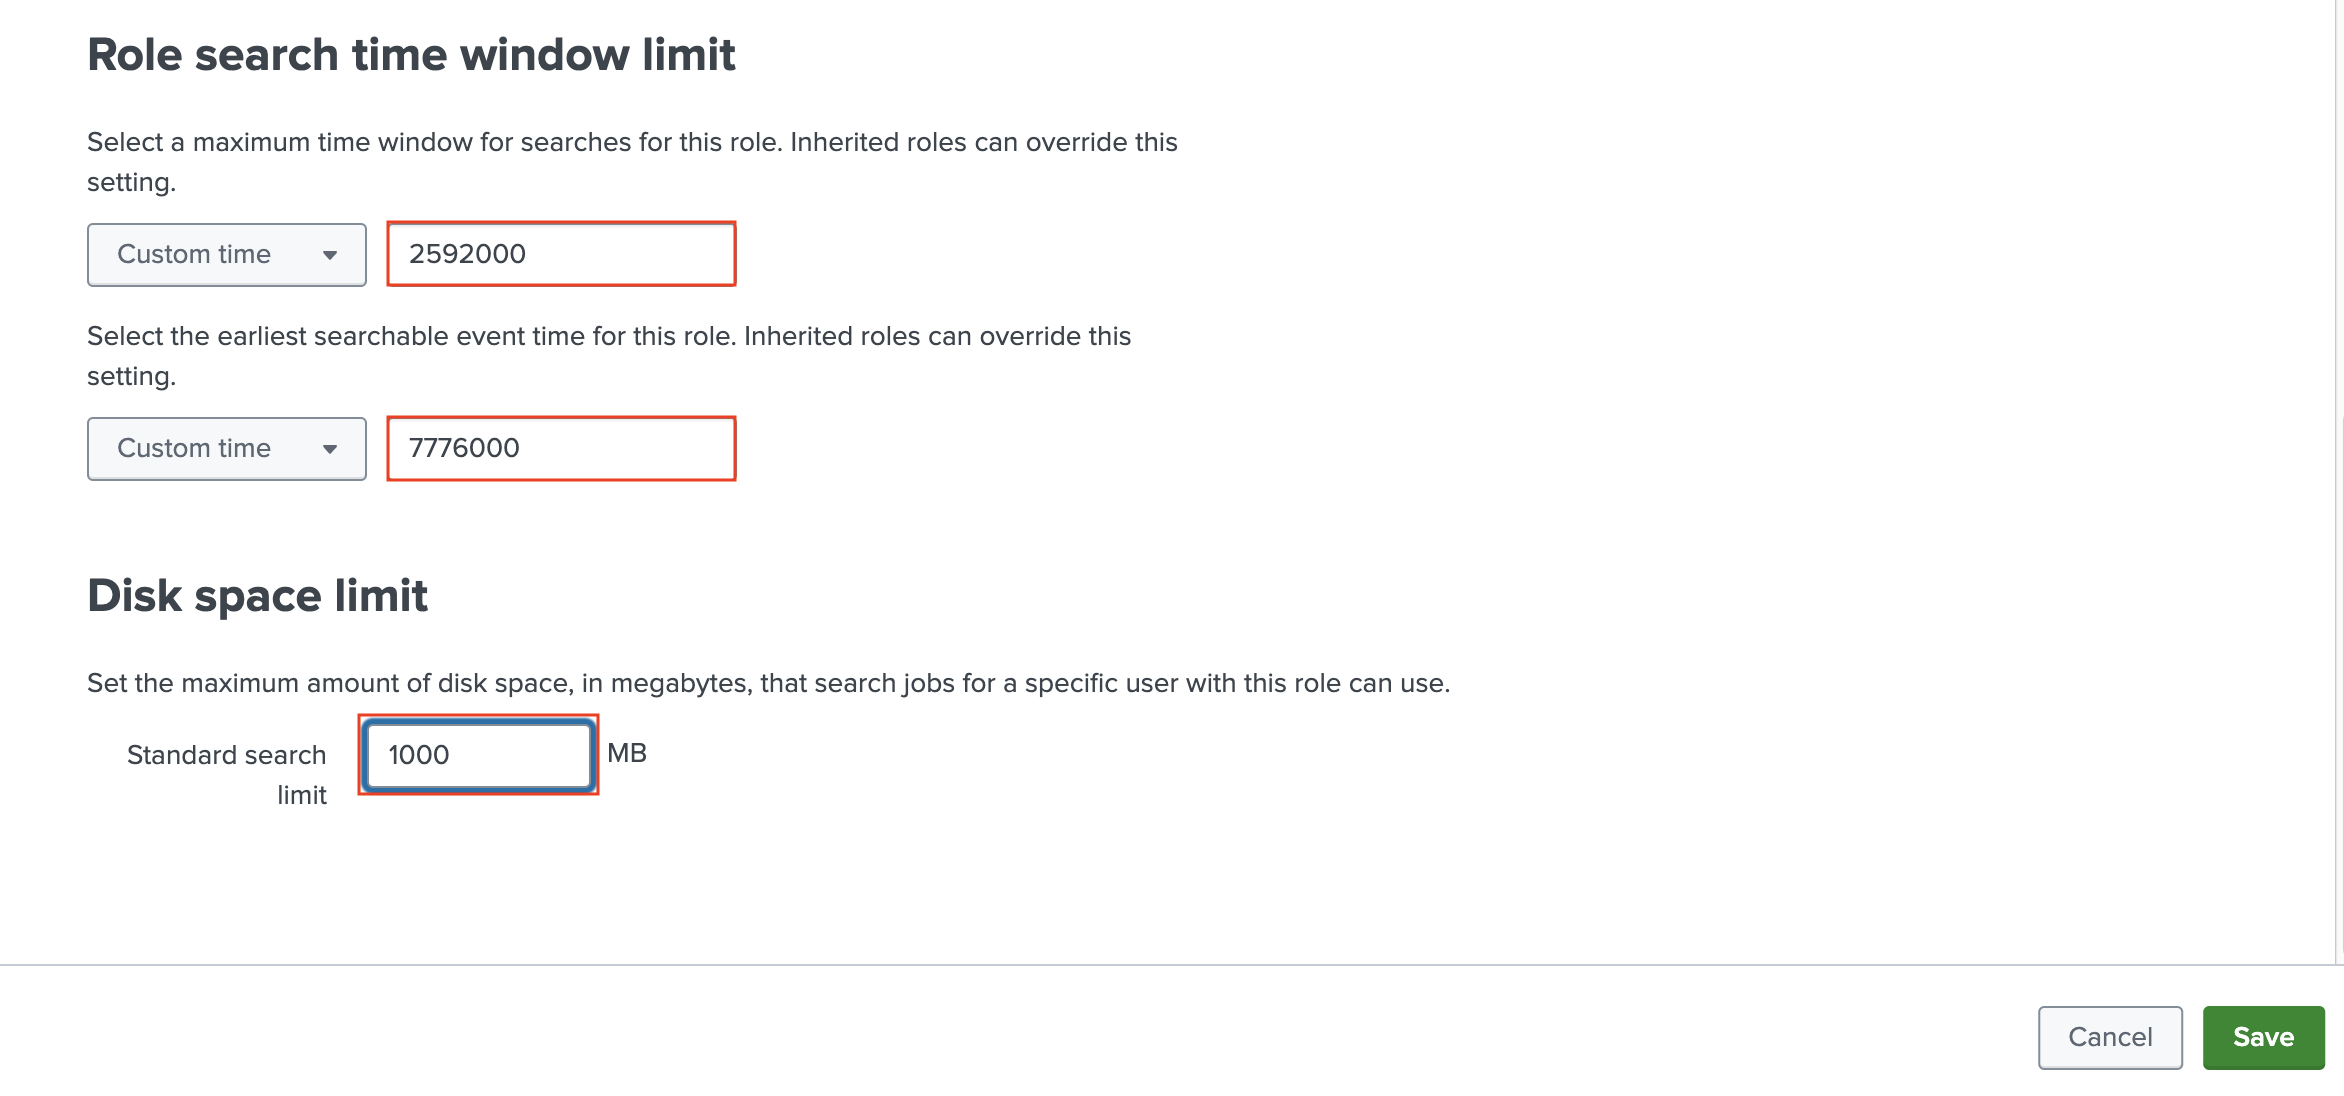
Now, in the Role search time window limit section of the Resources tab, select Custom time and enter 2592000 seconds (30 days) for the maximum time window for searches for this role. For the earliest searchable event time for this role, select Custom time and enter 7776000 seconds (90 days). In the Disk space limit section enter a Standard search limit of 1000 MB.
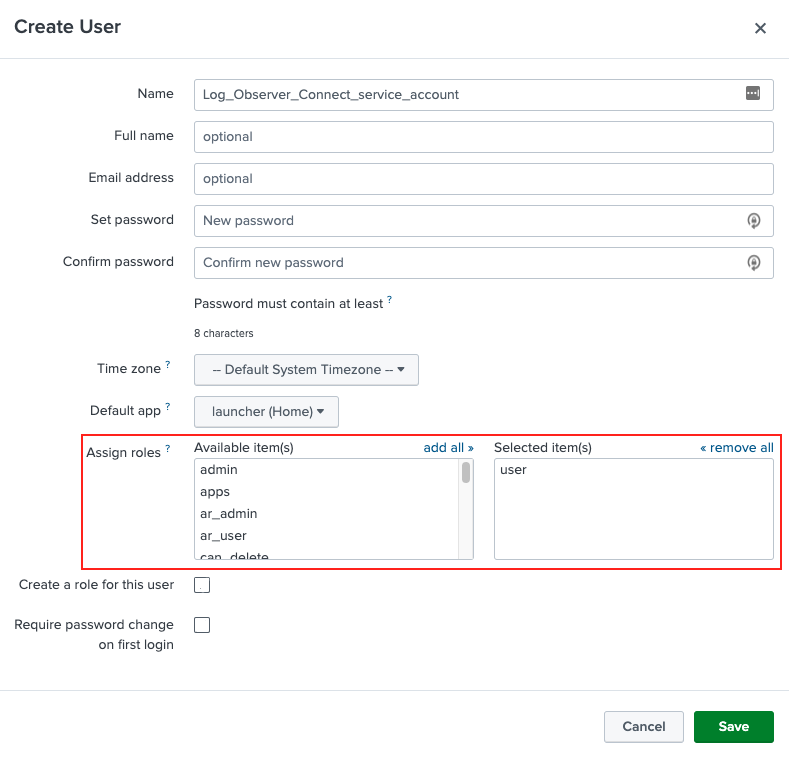
Next, create a user in Splunk Enterprise. Go to Settings then Users. Select New user to create the user for the Log Observer Connect service account. Assign to the user the role you created in the preceeding steps for the Log Observer Connect service account.
Add a Workload Rule in Splunk Enterprise to limit Log Observer Connect searches to 5 minutes. This limit maintains a responsive experience for Log Observer users and reduces the chances that Log Observer Connect searches are queued. Follow the guidance in Create a Workload Rule in Splunk Web and configure the rule as follows:
Predicate: user=[your_Log_Observer_Connect_service-account_name] AND runtime>5m
Schedule: Always on
Action: Abort search
After creating the Workload Rule, it appears in Workload Management on the Workload Rules tab as follows:

Complete the steps on the Secure a connection to the Splunk platform section to get certificates for securing inter-Splunk communication. See Configure and install certificates in Splunk Enterprise for Splunk Log Observer Connect to learn how. Copy only the first certificate in the chain and paste it on the next page of the guided setup to securely connect Log Observer Connect and your Splunk Enterprise instance. When finished, select Next in the guided setup. When finished, select Next.
On the Set up Observability Cloud page of the guided setup, enter the following:
Service account username
Password
Splunk platform URL
Connection name (Make sure to give each connection a unique name.)
Certificate
Select Save and continue.
On the Configure permissions page of the guided setup, select the Splunk Observability Cloud users who you want to give access to this connection and the associated Splunk Enterprise indexes.
Select Save and activate.
Note
Manage concurrent search limits using your current strategy in Splunk Enterprise. All searches initiated by Log Observer Connect users go through the service account you create in Splunk Enterprise. For each active Log Observer Connect user, four back-end searches occur when a user performs a search in the Log Observer Connect UI. For example, if there are three concurrent users accessing the Log Observer Connect UI at the same time, the service account for Log Observer Connect initiates approximately 12 searches in Splunk Enterprise.
Troubleshooting 🔗
See Troubleshoot Log Observer Connect setup to learn how to solve common issues with Log Observer Connect.