Scenario: Aisha troubleshoots workflow failures with Log Observer Connect 🔗
Buttercup Games, a fictitious company, runs an e-commerce site to sell its products. They analyze logs in Splunk Cloud Platform. They recently refactored their site to use a cloud-native approach with a microservices architecture and Kubernetes for the infrastructure. They purchased Splunk Observability Cloud as their observability solution. Buttercup Games analyzes their Splunk Cloud Platform logs in Log Observer, a point-and-click Splunk Observability Cloud tool, which they set up through Log Observer Connect.
Buttercup Games site reliability engineers and service owners collaborate to monitor and maintain the site to ensure that people have a great experience when they visit. They use Splunk Observability Cloud to find and solve problems that cause outages or failures in purchases from their online store.
In the past hour, the number of purchases on the Buttercup Games site dropped significantly and the checkout completion rate is too low. Aisha, an SRE, and Deepu, a service owner, perform the following tasks with Splunk Log Observer and other views in Splunk Observability Cloud to identify and troubleshoot the root cause of the problem with the purchase workflow:
Determine which logs matter 🔗
Aisha opens the service map in Splunk Application Performance Monitoring (APM). To find out why the checkout completion rate is so low, they select the /cart/checkout business workflow on the service map. The service map now shows Aisha the dependency interactions among the full set of services backing the /cart/checkout workflow.
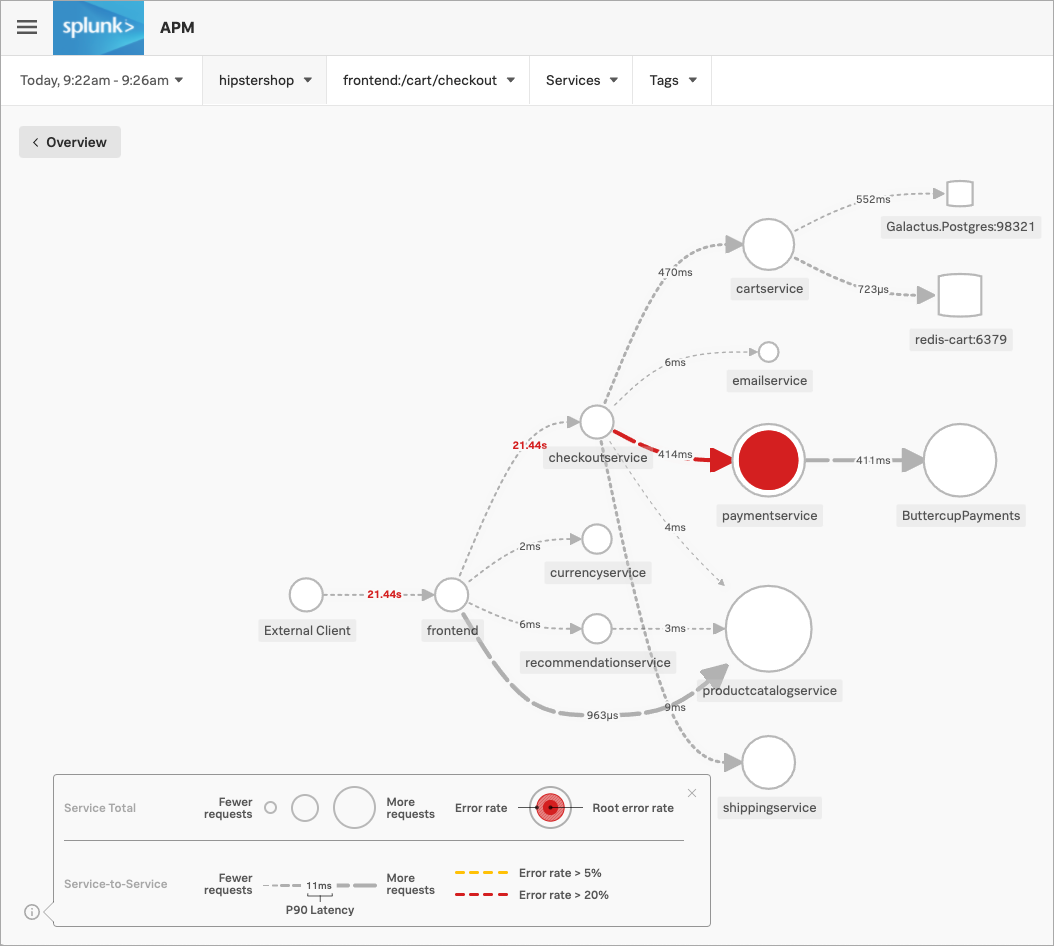
Aisha sees that paymentservice has the highest number of downstream errors that are contributing to a degraded experience for the workflow. Splunk APM identifies the issues as root cause errors. Aisha selects paymentservice. Splunk Observability Cloud displays details about the service’s errors and latency.
Splunk Observability Cloud also surfaces Related Content tiles that provide access to relevant data in other areas of the application. For example, Aisha can look at the health of the Kubernetes cluster where paymentservice is running or they can examine logs being issued by the paymentservice.
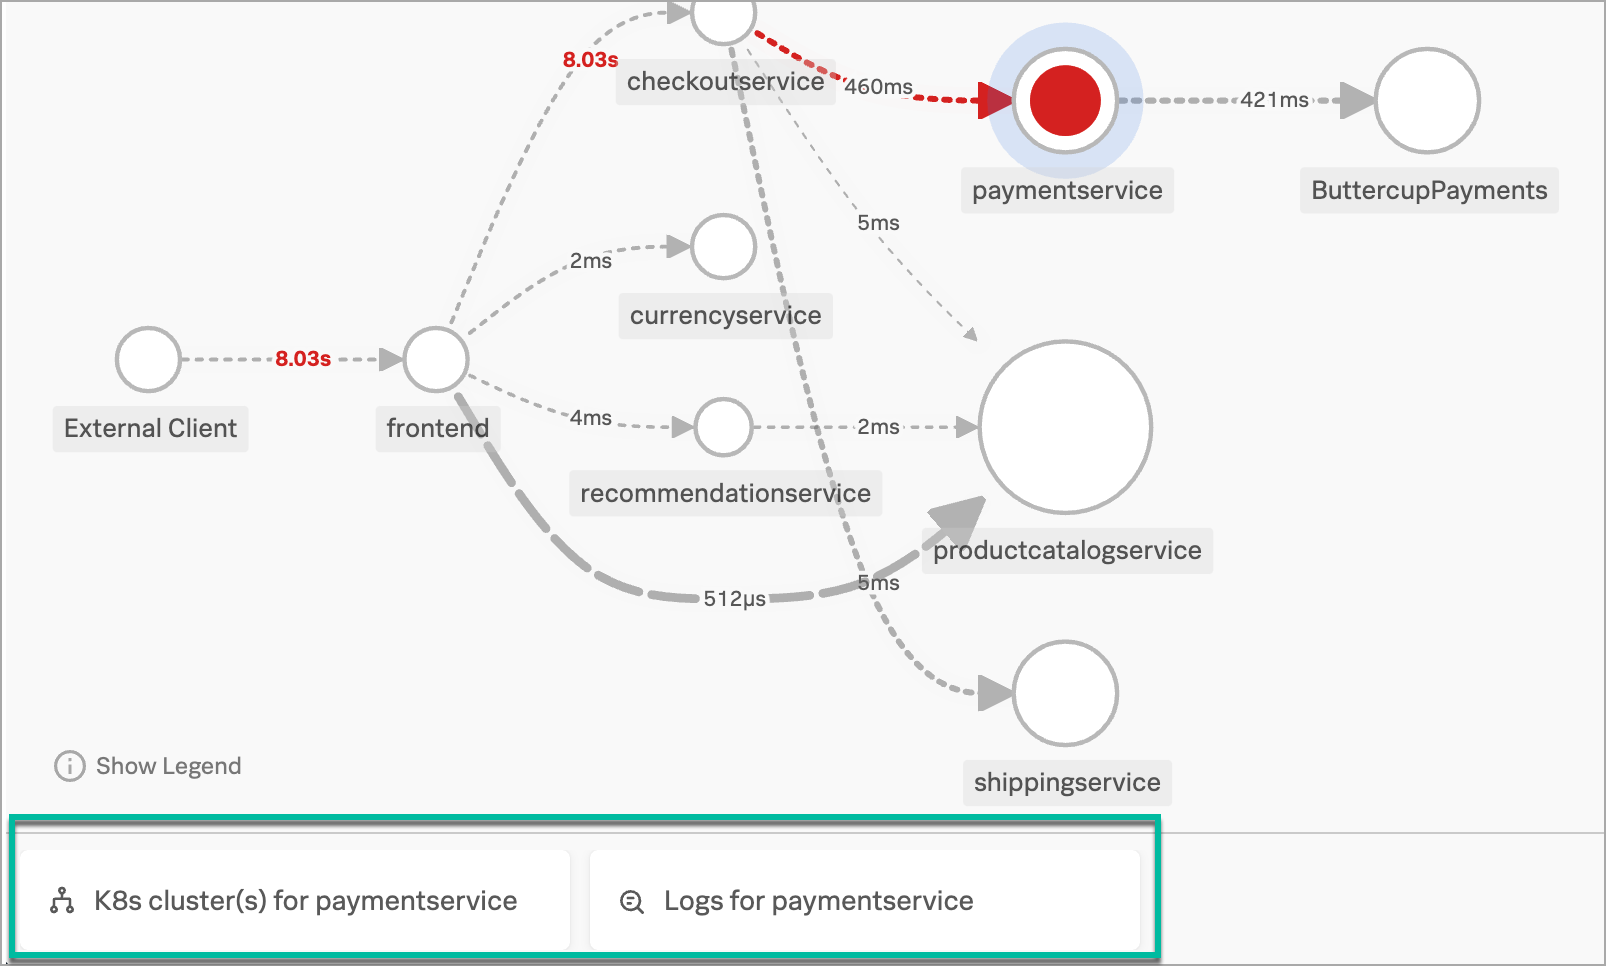
Aisha decides to look at the log details. They select the Related Content tile, Logs for paymentservice. Log Observer opens, and Aisha’s view is automatically narrowed to display only logs from paymentservice. Log Observer displays paymentservice logs that were sent in to Splunk Cloud Platform. Log Observer does not ingest the logs, but displays the logs from their storage in Splunk Cloud Platform.
Because Aisha first tracked the workflow problems in Splunk APM, they were able to narrow their search down to only logs coming from paymentservice. Now Aisha can use Log Observer to analyze the logs.
Conduct initial analysis of logs 🔗
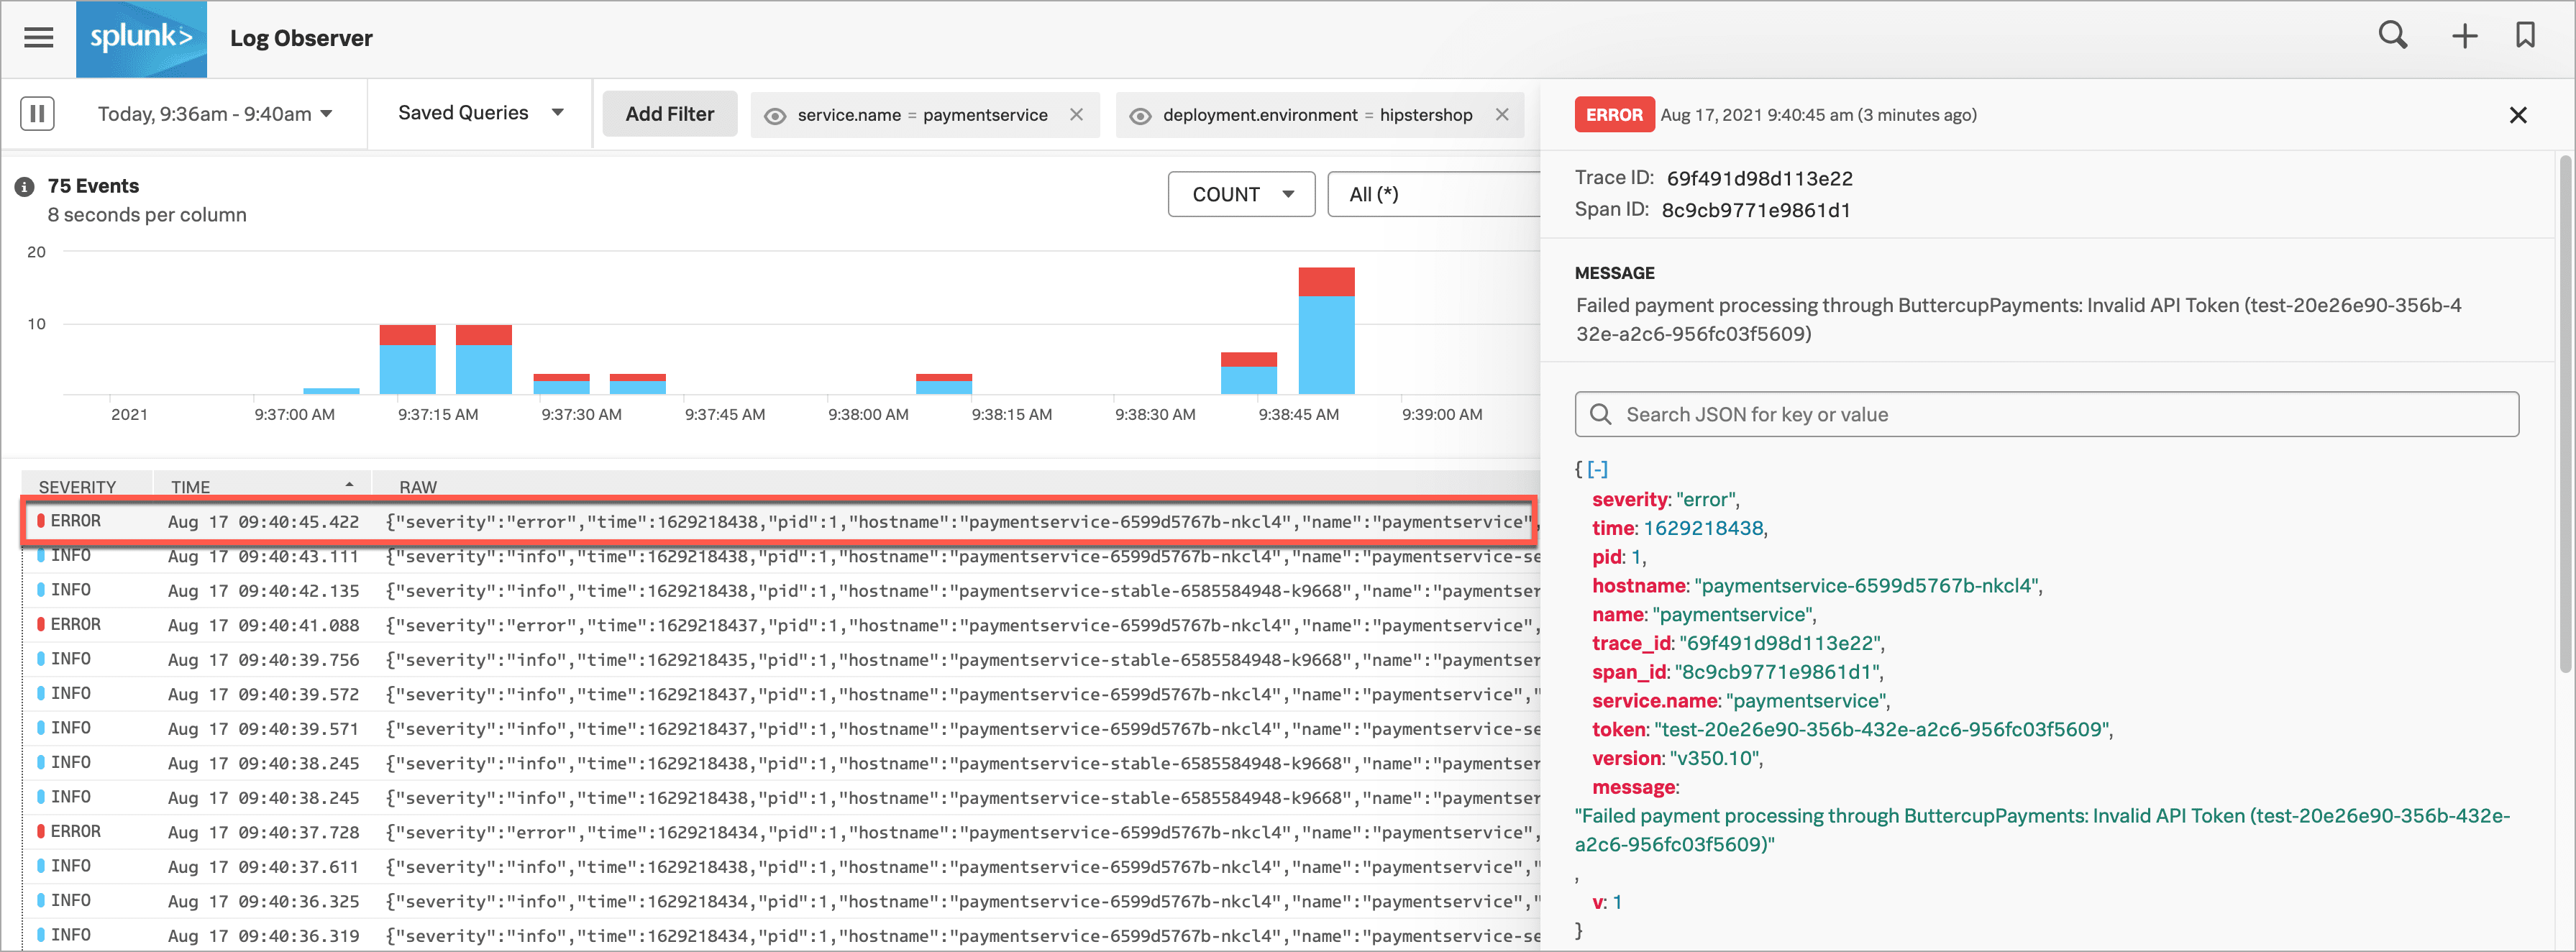
Aisha can query the paymentservice logs in Log Observer’s point-and-click UI, then filter and aggregate the logs to drill down to the underlying problem. For more complex analysis using SPL query language, they can continue their analysis of paymentservice logs in the Splunk Cloud Platform Search & Reporting application.
Looking through the incoming logs in the logs table, Aisha sees some error logs, so they select one to see more details in a structured view. In the log details view on the right, Aisha notices the error message: Failed payment processing through ButtercupPayments: Invalid API Token (test-20e26e90-356b-432e-a2c6-956fc03f5609).
Aisha decides to see if other logs have the same error message. If they can find a pattern, they can figure out what is causing the trouble.
Find log patterns 🔗
Aisha opens a few other logs to see if others have the same error message. Several of the logs Aisha opens have the same error message: Failed payment processing through ButtercupPayments: Invalid API Token (test-20e26e90-356b-432e-a2c6-956fc03f5609).
Aisha notes that all of the invalid API tokens start with “test”. Aisha hypothesizes that a team pushed the current version, v350.10, live with a test token that doesn’t work in production.
To double-check their hypothesis, Aisha selects the error message and selects Add to filter to show only the logs that contain the same error message.
Narrow the hypothesis 🔗
Next, Aisha wants to group the logs by version to see if the group of logs that contain the test API token are on multiple versions. They change the Group by field to version.
Now Aisha can see that all logs that contain the test API token are on version v350.10.

Aisha is pretty confident that they have isolated the problem to logs containing the error message: Failed payment processing through ButtercupPayments: Invalid API Token (test-20e26e90-356b-432e-a2c6-956fc03f5609) in only the most recent version, v350.1. Now they want to test their hypothesis.
Test the hypothesis 🔗
To be sure, Aisha selects the eye icon for the message filter value to temporarily exclude the filter. Now there are logs that show up for version v350.9 too, but they don’t include the error message. Aisha can now correlate all of the logs containing the test token error message, and no logs that don’t contain the error message, to version v350.10.
Identify the root cause and remediate 🔗
Their exploration in Log Observer convinces Aisha that the test API token in v350.10 is the most likely source of the failures to complete payment. Aisha rolls back the Buttercup Games code from the problematic v350.10 to v350.9.
Aisha notifies Deepu about the invalid API token, which is a test token. Deepu replaces the test token with a token that works in production.
Summary 🔗
When Buttercup Games’ e-commerce site began having a slow checkout completion rate and saw a drop in the number of purchases, a site reliability engineer, Aisha, looked at the /cart/checkout business workflow on the Splunk APM service map. They saw that APM identified the paymentservice as the root cause of errors. Aisha decided to look into the log details by linking from APM to related logs through the Related Content bar.
In Log Observer, Aisha noticed that several logs coming from paymentservice had the same error. The common error messages indicated that the API token started with “test”. They figured that the test token was the problem. They ruled out other possible problems by filtering and aggregating logs. They correlated the suspicious test token error message with only logs in v350.10.
Consulting with Deepu, the paymentservice owner, they agreed that the test API token was the likely cause of the problem. Aisha rolled back the code to the previous version because v350.9 logs did not contain the test token error message. Then Deepu replaced the test token with a token that works in production.
After the fix, users were able to complete checkout and make purchases from the Buttercup Games e-commerce site. To prevent similar problems in the future, Aisha decided to create a detector to alert their team when tokens contain “test”. The alert and detector will notify Aisha’s and Deepu’s teams before customers attempt to make purchases that will fail.
Learn more 🔗
For details on business workflows, see Correlate traces to track Business Workflows.
For details on using Related Content, see Related Content in Splunk Observability Cloud.
For details on Log Observer queries, see Query logs in Log Observer Connect.
For details on aggregating logs, see Group logs by fields using log aggregation.
For details on alerts and detectors, see Create detectors to trigger alerts.