Scenario: Kai creates a detector to monitor server latency 🔗
Kai, a site reliability engineer at Buttercup Games, receives many tickets from Buttercup Games customers experiencing high latency on game servers. Kai wants a reliable way to monitor their host machines’ server latency so they can quickly identify and solve high latency issues before customers experience them.
Using Splunk Observability Cloud, Kai can create a detector that alerts them whenever a server’s latency crosses a threshold for a period of time.
Define the data to use for alerting 🔗
Kai opens the Detectors & SLOs page in Splunk Observability Cloud and selects New Detector to create a detector from scratch.
After naming the detector, Kai chooses Infrastructure or Custom Metrics Alert Rule.
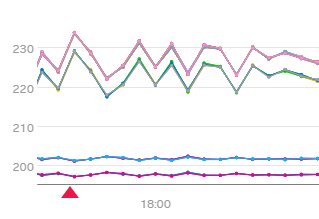
Kai selects their desired metric, latency, and sees a preview detector that reports on the metric:

Kai can apply analytics to change how the signal is reported. Kai wants to report on the average server latency over a 1-minute window, so Kai applies the Mean:Transformation analytic and enters a period of 1 minute.
The preview detector changes to reflect Kai’s applied analytic:

Choose an alert condition 🔗
Kai can choose between several options for an alert condition. Alert conditions determine the type of behavior that triggers an alert.
Kai chooses the Static threshold alert condition because they want to know when server latency exceeds a certain point for a certain duration of time. In other cases, Kai might want to choose a different alert condition. For example, Kai might choose the Sudden change condition if they want to be alerted when server latency rapidly increases.
Customize alert settings 🔗
In the Alert Setting menu, Kai enters desired values for the following fields:
Field |
Value |
Description |
|---|---|---|
Threshold |
280 |
The detector alerts when |
Duration |
1 minute |
The detector alerts when |
The detector preview shows red arrows on the timestamps when the detector triggers an alert:

Set up alert messages and recipients 🔗
After creating the alert condition, Kai selects Alert Message. Kai enters the runbook buttercupgames.com/alerts and adds an internal tip to check the memory load and disk usage on the server:

The runbook and tip allow Kai to quickly view their alerts and remind Kai what to do when an alert is triggered.
Kai then selects Alert Recipients and adds their email to the list of alert recipients. After adding their email, Kai activates the alert rule.
Summary 🔗
Kai has created a detector that sends them an alert whenever the average server latency over a 1-minute window exceeds a threshold of 280 milliseconds for 1 minute. This detector allows Kai to quickly detect and resolve server latency issues that they were previously unaware of.
Learn more 🔗
For more information on how to create a detector, see Create detectors to trigger alerts.
For more information on alert conditions and how to choose the right condition, see Built-in alert conditions.