Advanced Threat dashboards
Threat List Activity dashboard
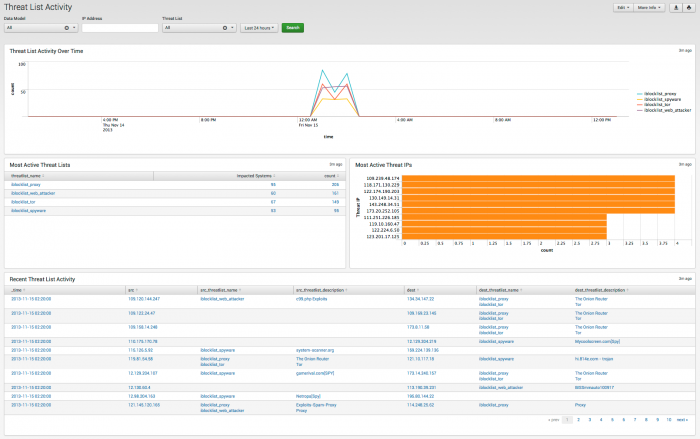
The Threat List Activity dashboard uses access data to help identify probable threats in your environment.
Relevant data sources
Relevant data sources for this dashboard include any access data collected by Splunk for your environment.
How to configure this dashboard
1. Index relevant data sources from a device, application, or system in Splunk.
2. Map the data to the Threat_Lists data model. See "Data models" in this manual for more about the Threat_Lists data model and the Common Information Model Add-on Manual for more information about data models. The Common Information Model fields bunit and category are derived by automatic identity lookup, and do not need to be mapped directly.
Dashboard description
Threat List Activity dashboard data is derived from the Threat_Lists data model and accelerated automatically. To verify that authentication data is present, use this search:
| datamodel Threat_Lists All_Threat_Lists search
To verify that events are being accelerated by the data model correctly, use this search (be careful not to search across all time):
| tstats summariesonly=true count from datamodel=Threat_Lists by user
For more information on distributed namespaces, see "Verify that a data model namespace exists" in the troubleshooting section of this manual. See "Tscollect" and "Data Model" in the Splunk Search Reference Manual for more information about data models and namespaces.
Useful searches/Troubleshooting
| Troubleshooting Task | Search/Action | Expected Result |
|---|---|---|
| Verify that you have data from your network device(s) | sourcetype=<your_sourcetype_for_your_data> | Returns data from your network device(s). |
| Verify that local access data exits | | datamodel Threat_Lists All_Threat_Lists search | Return local access data |
| Verify that authentication data is normalized to the Common Information Model properly | | datamodel Threat_Lists All_Threat_Lists search | table sourcetype action app src src_user dest user | Returns a list of events and the specific access activity fields of data populated from your device(s) |
Additional Information
For more information about using the Threat List Activity dashboard, see "Threat List Activity dashboard" in the Splunk App for Enterprise Security User Manual.
HTTP Category Analysis
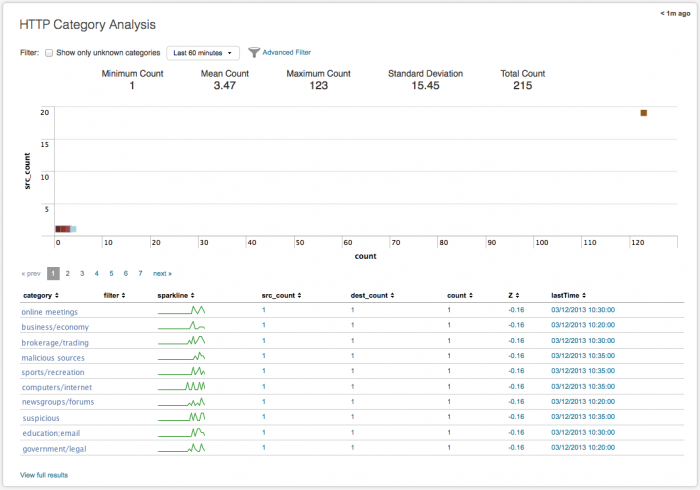
The HTTP Category Analysis dashboard can be used to investigate categories that appear infrequently in your proxy and HTTP traffic. The volume of HTTP traffic makes it difficult to investigate potential threats, so it is often used by attackers to gain access.
One way to detect potential threats is based on infrequent traffic to sites based on category. When a category is found to be safe, it can be whitelisted and removed from the view. Categories that are found to be threats can be blacklisted. See "Configure the Advanced Filter" in this manual for more information.
Need updated screenshot
The categories for this dashboard are defined in your deployment. Sparklines in the table show the activity from a category over the past 24 hours. You can control the timeframe and span shown by the sparkline using macros. See "Configure sparklines" for details on configuring sparkline macros.
Important: The Websense add-on (TA-Websense) needs to be installed and configured for this dashboard to work. The add-on feeds data from Websense (which detects cyber attacks and data theft), through the app to this dashboard.
Relevant data sources
Relevant data sources for the HTTP Category Analysis dashboard include HTTP web and proxy data from devices that collect web and proxy data.
Important: The Websense add-on (TA-Websense) needs to be installed and configured for this Splunk App for Enterprise Security dashboard to work.
How to configure this dashboard
1. Index relevant data sources from a device, application, or system in Splunk.
2. Map the data to the Web data model. See the Common Information Model Add-on Manual for more information. The Common Information Model fields bunit and category are derived by automatic identity lookup, and do not need to be mapped directly.
3. Tag your data with "web" AND "proxy".
Dashboard description
HTTP Category Analysis dashboard data is derived from the Web data model and accelerated automatically. To verify that authentication data is present, use this search:
| datamodel Web Web search
To verify that events are being accelerated by the data model correctly, use this search (be careful not to search across all time):
| tstats summariesonly=true count from datamodel=Web by user
For more information on distributed namespaces, see "Verify that a data model namespace exists" in the troubleshooting section of this manual. See "Tscollect" and "Data Model" in the Splunk Search Reference Manual for more information about data models and namespaces.
Useful searches/Troubleshooting
| Troubleshooting Task | Search/Action | Expected Result |
|---|---|---|
| Verify that you have data from your network device(s) | sourcetype=<your_sourcetype_for_your_data> | Returns data from your network device(s). |
| Verify that proxy data is indexed in Splunk | tag=web tag=proxy or | datamodel Web Web search |
Returns all web and proxy data from your device(s) |
| Verify that proxy data is normalized to the Common Information Model properly | | datamodel Web Web search | table status action http_method http_content_type http_user_agent src dest | Returns a list of events and the specific web and proxy data fields populated from your device(s) |
Additional information
For more information about using the HTTP Category Analysis dashboard, see "HTTP Category Analysis dashboard" in the Splunk App for Enterprise Security User Manual.
HTTP User Agent Analysis
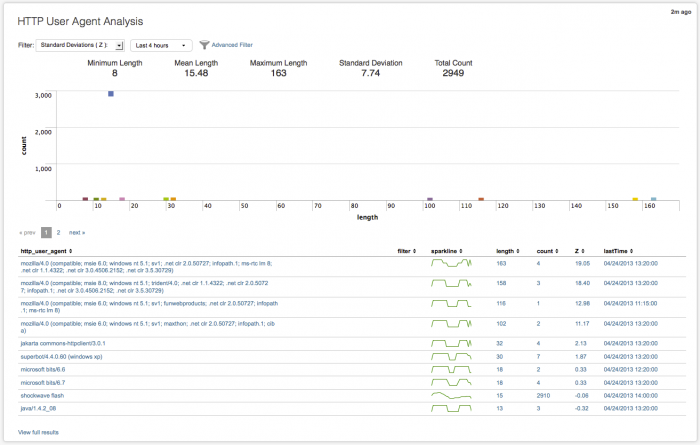
The HTTP User Agent Analysis dashboard analyzes user agent data found in HTTP traffic. User agent strings can be found in web gateway, web proxy, and HTTP server data (for example, IIS, Apache). User agent strings are often used by malicious traffic to gain access, due to the high volume of HTTP traffic.
Monitoring user agent strings can help detect unusually long or short strings, or user agent strings not normally seen in your deployment. Use this dashboard to monitor the various lengths of user agent string, compared to "normal", to detect malicious attacks.
Need updated screenshot
For example, if an unknown IP address is showing this user agent string:
User-Agent: Mozilla/4.75 [en] (X11, U; Nessus)
you probably have a issue you need to investigate.
See "Configure the Advanced Filter" in this manual for more information about the Advanced Filter.
Relevant data sources
Relevant data sources for the User Agent Analysis dashboard include web gateway, web proxy, and HTTP server data (for example, IIS, Apache).
How to configure this dashboard
1. Index relevant data sources from a device, application, or system in Splunk.
2. Map the data to the Web data model. See the Common Information Model Add-on Manual for more information. The Common Information Model fields bunit and category are derived by automatic identity lookup, and do not need to be mapped directly.
3. Tag your data with "web" AND "proxy".
Dashboard description
HTTP User Agent Analysis dashboard data is derived from the Web data model and accelerated automatically. To verify that authentication data is present, use this search:
| datamodel Web Web search
To verify that events are being accelerated by the data model correctly, use this search (be careful not to search across all time):
| tstats summariesonly=true count from datamodel=Web by user
For more information on distributed namespaces, see "Verify that a data model namespace exists" in the troubleshooting section of this manual. See "Tscollect" and "Data Model" in the Splunk Search Reference Manual for more information about data models and namespaces.
Useful searches/Troubleshooting
| Troubleshooting Task | Search/Action | Expected Result |
|---|---|---|
| Verify that you have data from your network device(s) | sourcetype=<your_sourcetype_for_your_data> | Returns data from your network device(s). |
| Verify that traffic data is indexed in Splunk | tag=web tag=proxy or | datamodel Web Web search |
Returns all user agent data from your device(s) |
| Verify that traffic data is normalized to the Common Information Model properly | | datamodel Web Web search | http_user_agent len(http_user_agent) values(src) values(dest) count | Returns a list of events and the specific user agent data fields populated from your device(s) |
Additional information
For more information about using the HTTP User Agent Analysis dashboard, see "HTTP User Agent Analysis dashboard" in the Splunk App for Enterprise Security User Manual.
New Domain Analysis
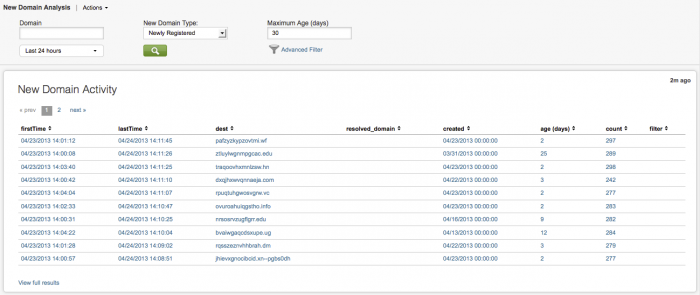
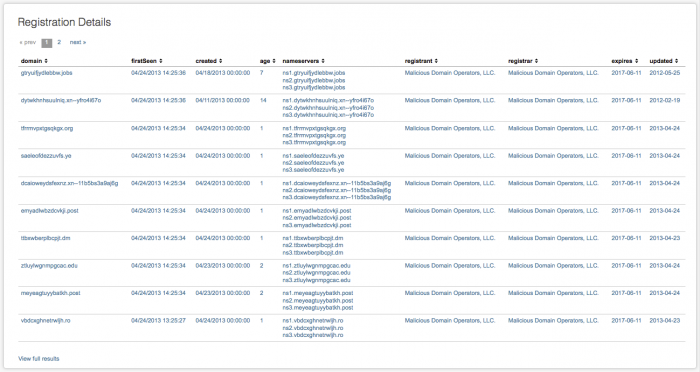
The New Domain Analysis dashboard shows any new domains that appear in your environment. These domains can be newly registered, or simply newly seen by the app. Panels display New Domain Activity events, New Domain Activity by Age, New Domain Activity by Top Level Domain (TLD), and Registration Details for these domains.
Need updated screenshot
Any new top level domains that you do not usually see in your deployment (for instance from another country or entity), would be something you would want to investigate. A sudden increase in traffic from top level domains like .cn or .ru could indicate a botnet.
Relevant data sources
Relevant data sources for the New Domain Analysis dashboard include any web or proxy data.
How to configure this dashboard
The New Domain Analysis dashboard is the most complex dashboard to configure. To provide the full set of features, connectivity to an external data source is necessary, in addition to indexing and mapping data.
Configure external API for populating dashboard
To populate the New Domain Analysis dashboard, connectivity to an external domain lookup data source must be configured. Enterprise Security provides a script to query the domaintools.com API for WHOIS data. Until API access is configured and enabled, the dashboard will only report on whether or not a domain is newly seen.
- Most of the data in the dashboard will be missing, including these fields in the "Registration Details" panel.
| created | age | nameservers | registrant |
| registrar | expires | updated |
To configure WHOIS API access:
1. Sign up for a domaintools.com account. Collect the API host name and the API access credentials from the site. The API host will be either "freeapi.domaintools.com" or "api.domaintools.com", depending on the level of access you decide to purchase.
- Important: The API access credentials are not the account email address.
2. Configure the "Network Queries" modular input from the Manager:
https://<localhost>:8000/en-US/manager/SplunkEnterpriseSecuritySuite/data/inputs/whois
3. Create a shared storage credential to store the API key used with the account.
- Using the
curlutility - The syntax for using thecurlutility is:
Command:
- Using the
WGETutility - The preferred option on Windows is to use the WGET for Windows utility.
Command:
4. Enable the modular input. Go to Manager > Data Inputs > Network Queries. Click Enable next to "whois_domaintools".
- Since the checkpoint directory could "fill up" with files if the modular input is not running, domains are not queued for processing by the
whois.pymodular input until the modular input is enabled.
To enable the modular input, edit the $SPLUNK_HOME/etc/apps/DA-ESS-NetworkProtection/default/ macros.conf file and enable the "outputcheckpoint_whois" macro:
Before:
   ###### Web Domain Tracker ######
   [outputcheckpoint_whois]
   ## Default
   definition = noop
   ## Local override to enable output to whois modular input
   #[outputcheckpoint_whois]
   #definition = outputcheckpoint modinput=whois
After:
   ###### Web Domain Tracker ######
   #[outputcheckpoint_whois]
   ## Default
   #definition = noop
   ## Local override to enable output to whois modular input
   [outputcheckpoint_whois]
   definition = outputcheckpoint modinput=whois
5. After you make these changes, a refresh of the macros endpoint or a restart of Splunk may be required for the changes to take effect:
Macro refresh:
https://<localhost>:8000/en-US/debug/refresh?entity=admin/macros
After the refresh, the following should be true:
- Entries are created in the
$SPLUNK_HOME/etc/apps/DA-ESS-NetworkProtection/lookups/web_domain_tracker.csvrepresenting domains newly seen in proxy data. This lookup is populated by the "Network - Web Domain Tracker - Lookup Gen" post-process search.
- The
$SPLUNK_HOME/var/lib/splunk/modinputs/whoisdirectory should have a file created in it at 20-minute intervals, consisting of new domains seen in the last 20 minutes (if any), also created by the "Network - Web Domain Tracker - Lookup Gen" search.
- The
whoisindex should begin to populate with data once a file exists in the$SPLUNK_HOME/var/lib/splunk/modinputs/whoisdirectory. Checkpoint files are deleted once they are processed.
- The
sa_whoisTSIDX namespace should populate with data in it 5 minutes after thewhoisindex is populated.
This search will show the data:
| tstats prestats=false count from sa_whois where * groupby _time created domain expires nameservers registrant registrar retrieved updated
Configure other data for this dashboard
1. Index relevant data sources from a device, application, or system in Splunk.
2. Tag your data with "proxy" AND "web".
Dashboard description
New Domain Analysis dashboard data is derived from the Domain_Analysis data model and accelerated automatically. To verify that authentication data is present, use this search:
| datamodel Domain_Analysis All_Domains search
To verify that events are being accelerated by the data model correctly, use this search (be careful not to search across all time):
| tstats summariesonly=true count from datamodel=Domain_Analysis by user
For more information on distributed namespaces, see "Verify that a data model namespace exists" in the troubleshooting section of this manual. See "Tscollect" and "Data Model" in the Splunk Search Reference Manual for more information about data models and namespaces.
Useful searches/Troubleshooting
| Troubleshooting Task | Search/Action | Expected Result |
|---|---|---|
| Verify that you have data from your network device(s) | sourcetype=<your_sourcetype_for_your_data> | Returns data from your network device(s). |
| Verify that network data is indexed in Splunk | tag=web tag=proxy or | datamodel Domain_Analysis All_Domains search |`get_whois` |
Returns new domain data |
| Verify that network data is normalized to the Common Information Model properly | | datamodel Domain_Analysis All_Domains search |`get_whois`| table _time created domain resolved_domain expires nameservers registrant registrar retrieved updated | Returns a list of events and new domain fields populated from your device(s) |
Additional Information
For more information about using the New Domain Analysis dashboard, see "New Domain Analysis dashboard" in the Splunk App for Enterprise Security User Manual.
Traffic Size Analysis
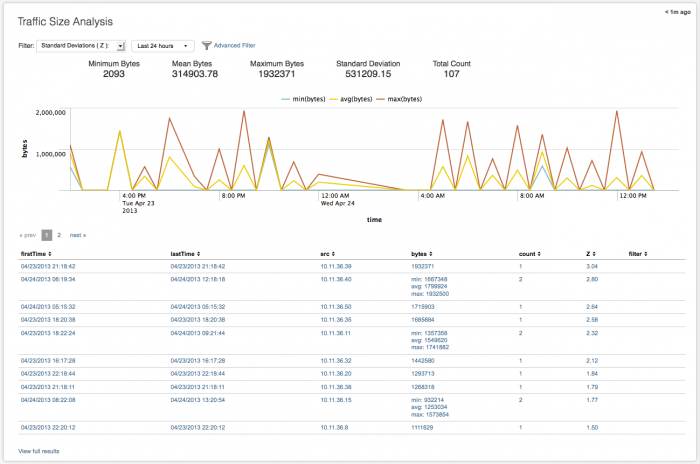
The Traffic Size Analysis dashboard looks at traffic data to find those connections with large byte counts per request, or those that are making a high number of connection attempts, but with small byte count sizes. Any traffic data -- firewall, router, switch, or network flows -- can be summarized and viewed in this dashboard.
Need updated screenshot
Note: For first time use of this dashboard, you may have to wait up to four hours before data is displayed because the Network - Traffic Bytes Tracker - Lookup Gen search runs every four hours.
Relevant data sources
Relevant data sources for the Traffic Size Analysis dashboard include data from any traffic data; firewall devices, routers, switch, and traffic flow.
How to configure this dashboard
1. Index relevant data sources from a device, application, or system in Splunk.
2. Map the data to the Network Traffic data model. See the Common Information Model Add-on Manual for more information. The Common Information Model fields bunit and category are derived by automatic identity lookup, and do not need to be mapped directly.
3. Tag your data with "network" AND "communicate".
Dashboard description
Traffic Size Analysis dashboard data is derived from the Network_Traffic data model and accelerated automatically. To verify that authentication data is present, use this search:
| datamodel Network_Traffic All_Traffic search
To verify that events are being accelerated by the data model correctly, use this search (be careful not to search across all time):
| tstats summariesonly=true count from datamodel=Network_Traffic by user
For more information on distributed namespaces, see "Verify that a data model namespace exists" in the troubleshooting section of this manual. See "Tscollect" and "Data Model" in the Splunk Search Reference Manual for more information about data models and namespaces.
Useful searches/Troubleshooting
| Troubleshooting Task | Search/Action | Expected Result |
|---|---|---|
| Verify that you have data from your network device(s) | sourcetype=<your_sourcetype_for_your_data> | Returns data from your network device(s). |
| Verify that traffic data is indexed in Splunk | tag=network tag=communicate or | datamodel Network_Traffic All_Traffic search |
Returns traffic data from your device(s) |
| Verify that traffic data is normalized to the Common Information Model properly | | datamodel Network_Traffic All_Traffic search | table action, dvc, transport, src, dest, src_port, dest_port, vendor_product | Returns a list of events and the specific traffic data fields populated from your device(s) |
Additional Information
For more information about using the Traffic Size Analysis dashboard, see "Traffic Size Analysis dashboard" in the Splunk App for Enterprise Security User Manual.
URL Length Analysis
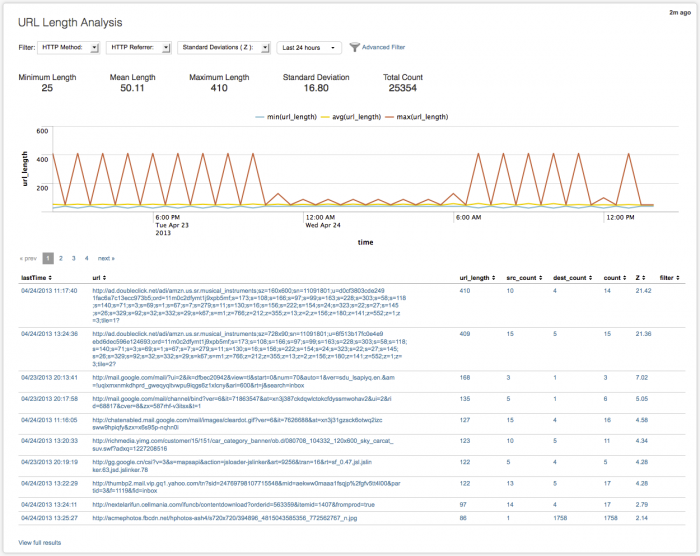
Use the URL Length Analysis dashboard to investigate long URL paths and strings in your proxy data and determine if there is a possible threat to your environment. Unusually long URL paths from unfamiliar sources and/or to unfamiliar destinations are often indicators of malicious access. Profile the URL paths accessing your deployment to identify the smallest, largest, and mean size of the URL paths and strings, and easily compare those with strings identified as "long".
Need updated screenshot
Look for abnormal length URLs that contain what looks like SQL commands for SQL injections, cross-site scripting (XSS), or other malicious content.
Relevant data sources
Relevant data sources for the URL Length Analysis dashboard include web and proxy data collected in your environment; any traffic data, firewall device data, router and switch data.
How to configure this dashboard
1. Index relevant data sources from a device, application, or system in Splunk.
2. Map the data to the Web data model. See the Common Information Model Add-on Manual for more information. The Common Information Model fields bunit and category are derived by automatic identity lookup, and do not need to be mapped directly.
3. Tag your data with "proxy" AND "web".
Dashboard description
URL Length Analysis dashboard data is derived from the Web data model and accelerated automatically. To verify that authentication data is present, use this search:
| datamodel Web Web search
To verify that events are being accelerated by the data model correctly, use this search (be careful not to search across all time):
| tstats summariesonly=true count from datamodel=Web by user
For more information on distributed namespaces, see "Verify that a data model namespace exists" in the troubleshooting section of this manual. See "Tscollect" and "Data Model" in the Splunk Search Reference Manual for more information about data models and namespaces.
Useful searches/Troubleshooting
| Troubleshooting Task | Search/Action | Expected Result |
|---|---|---|
| Verify that you have data from your network device(s) | sourcetype=<your_sourcetype_for_your_data> | Returns data from your network device(s). |
| Verify that URL data is indexed in Splunk | tag=proxy tag=web or | datamodel Web Web search |
Returns all URL data from your device(s) |
| Verify that URL data is normalized to the Common Information Model properly | | datamodel Web Web search |table src dest url_length | Returns a list of events and URL length data fields populated from your device(s) |
Additional information
For more information about using the URL Length Analysis dashboard, see "URL Length Analysis dashboard" in the Splunk App for Enterprise Security User Manual.
Configure sparklines
You can use macros to control the time frame and span of the sparklines on a dashboard. Add these macros to $SPLUNK_HOME/etc/apps/SplunkEnterpriseSecuritySuite/default/macros.conf.
[http_user_agent_sparkline_earliest]
definition = 86400The http_user_agent_sparkline_earliest macro is specified in number of seconds.
[http_user_agent_sparkline_span]
definition = 1hThe http_user_agent_sparkline_span macro is specified as a date/time specifier.
| Event Investigator dashboards | Security Domains |
This documentation applies to the following versions of Splunk® Enterprise Security: 3.0, 3.0.1


 Download manual
Feedback submitted, thanks!