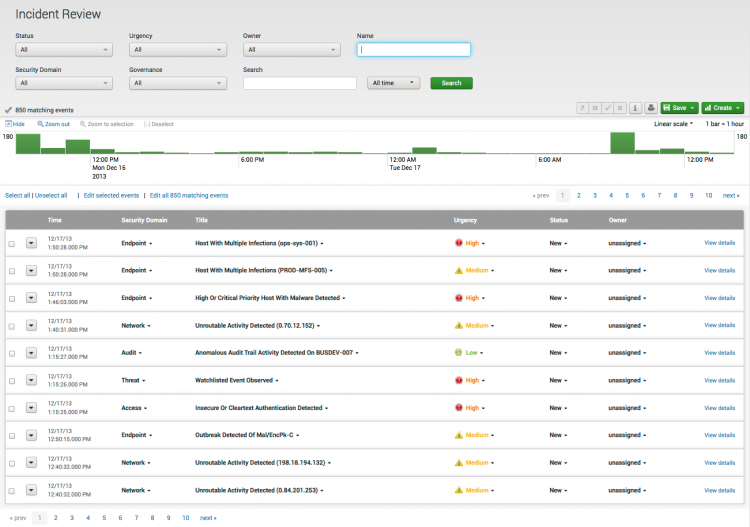
Incident Review dashboard
The Incident Review dashboard shows all current notable events across your deployment, populated by notable events aggregated from the other domain dashboards. By default, the search parameters are set to "All". Modify the search parameters to refine your search by status, urgency, owner, security domain, or governance. Choose a time range for your search and click Search.
Use this dashboard to identify and investigate issues, perform incident reviews, set event status, and assign events to analysts for review. From here you can drill down to other specific dashboards and domains.
To view the details of an event, select an event and click View details. Select an event and then click Edit... to change the urgency, status, or owner of an event.
| Security Posture dashboard | Predictive Analytics dashboard |
This documentation applies to the following versions of Splunk® Enterprise Security: 3.0, 3.0.1

 Download manual
Feedback submitted, thanks!