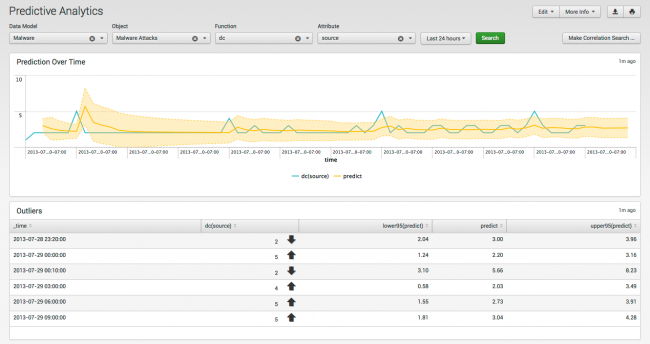
Predictive Analytics dashboard
| Configuration information on this page is currently a work in progress; expect frequent near-term updates. |
The Predictive Analytics dashboard uses the predictive analysis functionality in Splunk to provide statistical information about the your search results and identify outliers in your data.
Choose the data model, object, function, attribute, and time range for your search. The graph shows probably results over time and a table displays individual events that fall outside of the predicted range.
Relevant data sources
Relevant data sources for this dashboard include searches generated by a data model and filtered to
How to configure this dashboard
1. Index relevant data sources from a device, application, or system in Splunk.
2. Map the data to the data models in your deployment. See the Common Information Model Add-on Manual for more information. The Common Information Model fields bunit and category are derived by automatic identity lookup, and do not need to be mapped directly.
Dashboard description
Predictive Analytics dashboard data is derived from the data model you select for your search, and accelerated automatically. To verify that authentication data is present, use this search:
| datamodel <data_model_name> <object_object> search
To verify that events are being accelerated by the data model correctly, use this search (be careful not to search across all time):
| tstats summariesonly=true count from datamodel=<data_model_name> by user
For more information on distributed namespaces, see "Verify that a data model namespace exists" in the troubleshooting section of this manual. See "Tscollect" and "Data Model" in the Splunk Search Reference Manual for more information about data models and namespaces.
Useful searches/Troubleshooting
| Troubleshooting Task | Search/Action | Expected Result |
|---|---|---|
| Verify that you have data from your network device(s) | sourcetype=<your_sourcetype_for_your_data> | Returns data from your network device(s). |
| Verify that authentication data is normalized to the Common Information Model properly | | datamodel <data_model_name> <object_name> search | table sourcetype action app src src_user dest user | Returns a list of events and the specific access activity fields of data populated from your device(s) |
Additional Information
For more information about using the Predictive Analytics dashboard, see "Predictive Analytics dashboard" in the Splunk App for Enterprise Security User Manual.
| Incident Review dashboard | Event Investigator dashboards |
This documentation applies to the following versions of Splunk® Enterprise Security: 3.0, 3.0.1

 Download manual
Feedback submitted, thanks!