Key indicators
Key indicators are used on Enterprise Security dashboards to display selected information about notable events in a given domain or in different domains.
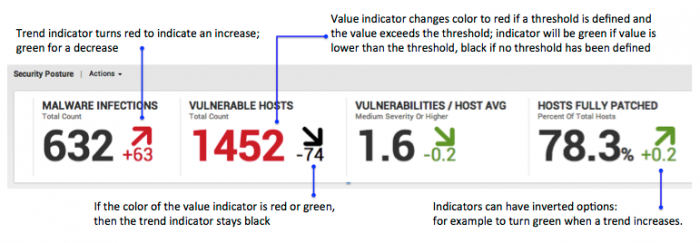
Colors indicate changes in the total number of events, as well as changes in trends of events..
Some security-related events are expected in a normal environment. However, a spike in certain security events may indicate a deeper problem.
Key indicators are available in these dashboards:
- Access Center
- HTTP Category Analysis
- HTTP User Agent Analysis
- Intrusion Center
- Malware Center
- Security Posture
- Traffic Center
- Traffic Size Analysis
- Update Center
- URL Length Analysis
- Vulnerability Center
We recommend that you install Enterprise Security and index data for fourteen days before setting any alert thresholds for your key indicators. This will provide the data necessary to set the thresholds accurately.
Key indicator description
As an example, the key indicators at the top of the Security Posture dashboard display information about notable events in different domains over the last 24 hours.
Each indicator shows the the current number of events, the change in number of events, and the trend in data (with an arrow and a plus or minus for the number of events) in the past day. The key indicators are populated by searches.
The key indicators can be added or removed, and rearranged in the order you prefer.
Edit key indicators
To edit the key indicators for a dashboard:
Click the pencil icon on the left of the indicators. The editing tools are displayed above the indicators.
- To remove an indicator, click the "X" next to that indicator.
- Drag and drop the indicators to arrange them in your preferred order.
Add new indicators
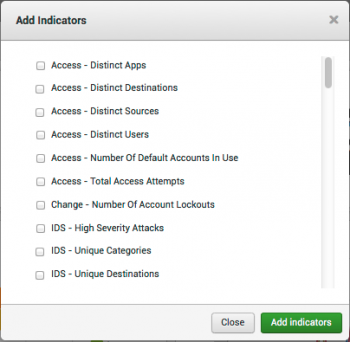
1. To add new indicators, click the "+" in the tab below the indicators to open the Add indicators panel.
2. Select indicators from the list and click Add indicators. The new indicators are added to the panel.
3. Click the checkmark to save the new indicators.
Set indicator thresholds
Indicator thresholds can be set by finding the key indicator search (in /etc/apps/SplunkEnterpriseSecuritySuite/local/savedsearches.conf) and specifying the "action.keyindicator.threshold" field.
Here is an example with the threshold set to 15:
[Access - Number Of Default Accounts In Use]
action.email.reportServerEnabled              = 0
alert.track                                   = 0
action.keyindicator                           = 1
action.keyindicator.title                     = Default Accounts
action.keyindicator.subtitle                  = Distinct Accounts
action.keyindicator.value                     = current_count
action.keyindicator.threshold                 = 15
...
Variable substitution in attributes
If you want to change the title of a key indicator to the value from the search results, you can use variable substitution in the key indicators attributes. For instance, if the search results contain a field called "foo", then you could set the title to "Foo is $foo$" and it would replace $foo$ with the value of the field in the search results.
To change the variable, make the change to the specific key indicator stanzas in /etc/apps/SplunkEnterpriseSecuritySuite/local/savedsearches.conf. The stanzas are in /default/savedsearches.conf.
For example, to change the key indicator for Notable Events by Threat Domain, modify the search in the /local/savedsearches.conf file.
[Notable - Total Events By Threat Domain]
.
.
.
Copy the stanza for this key indicator into your /local/savedsearches.conf file and add this to the search.
Create custom key indicators
The Enterprise Security app contains a large number of pre-defined key indicators based upon the security domain dashboards included with the app. You can also manually create new key indicators and make them available for use on dashboards in the Enterprise Security app. A key indicator is a UI object with a specific visual output. It includes an event count, a differential count, a direction indicator, and color coding to indicate the importance or priority of the differential count.
Here is a sample of a custom key indicator as it is found in a ../local/savedsearches.conf file:
  [AWS Account Deletion Events]
  action.email.reportServerEnabled = 0
  action.keyindicator = 1

  action.keyindicator.group.0.name =

  action.keyindicator.group.0.order =
  action.keyindicator.invert = 0
  action.keyindicator.subtitle = Accounts
  action.keyindicator.threshold = 10
  action.keyindicator.title = AWS Account Deletions
  action.keyindicator.value = current_count
  action.keyindicator.delta = delta
  action.keyindicator.value_suffix = attempts
  action.keyindicator.drilldown_uri = search?q=search%20tag%3Daccount%20tag%3Dmanagement%20action%3Ddeleted%20sourcetype%3Daws%3Acloudtrail%20earliest%3D-24h%40h%20latest%3D%2B0s
  alert.track = 0
  search = | tstats `summariesonly` count as current_count from datamodel=Change_Analysis where nodename="All_Changes.Account_Management.Accounts_Deleted" earliest=-24h@h latest=+0s sourcetype=aws:cloudtrail | appendcols [| tstats `summariesonly` count as historical_count from datamodel=Change_Analysis where nodename="All_Changes.Account_Management.Accounts_Deleted" earliest=-48h@h latest=-24h@h sourcetype=aws:cloudtrail] | `get_delta`
The search used to populate the key indicator must include a count. To make use of the other UI elements in a key indicator, the search must also provide a count differential to drive the change value and direction indicator. The threshold value determines the colors used on the count differential, and an invert option is available to flip the arrow direction as needed. A data model is not required to drive the indicator, but is used to speed up the results.
| General settings | Identity Manager |
This documentation applies to the following versions of Splunk® Enterprise Security: 3.0, 3.0.1


 Download manual
Feedback submitted, thanks!