Audit dashboards
| Configuration information on this page is currently a work in progress; expect frequent near-term updates. |
The Audit dashboards validate the security of the data, and include resources for ensuring that forwarders are functioning, that data has not been tampered with, that data is secured in transmission, and that the incidents detected by the rules are being reviewed.
Incident Review Audit
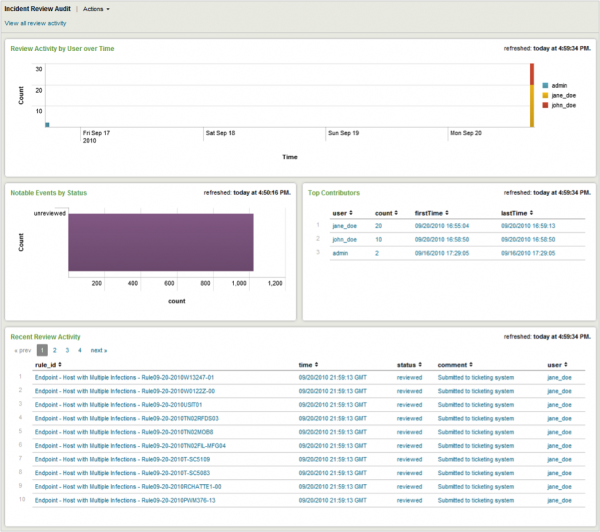
The Incident Review Audit dashboard gives you an overview of incident review activity and insight into how many incidents are being reviewed and by whom, and a list of the most recently reviewed events.
Need updated screen shot
Relevant data sources
Relevant data sources for the Incident Review Audit dashboard includes network and application activity data, along with asset and identity information.
How to configure this dashboard
1. Index relevant data sources from a device, application, or system in Splunk.
2. Map the data to the Incident_Management data model in this manual. See the Common Information Model Add-on Manual for more information about data models. The Common Information Model fields bunit and category are derived by automatic identity lookup, and do not need to be mapped directly.
3. Tag your data with "default" OR "privileged".
Dashboard description
Incident Review Audit dashboard data is derived from the Incident_Management data model and accelerated automatically.
To verify that incident data is present, use this search:
| datamodel Incident_Management search
To verify that events are being accelerated by the data model correctly, use this search (be careful not to search across all time):
| tstats summariesonly=true count from datamodel=Incident_Management by user
For more information on distributed namespaces, see "Verify that a data model namespace exists" in the troubleshooting section of this manual. See "Tscollect" and "Data Model" in the Splunk Search Reference Manual for more information about data models and namespaces.
Useful searches/Troubleshooting
| Troubleshooting Task | Search/Action | Expected Result |
|---|---|---|
| Verify that you have data from your network device(s) | sourcetype=<your_sourcetype_for_your_data> | Returns data from your network device(s). |
| Verify that incident review audit data is indexed in Splunk | tag=default OR tag=privileged or | datamodel Incident_Management search |
Returns all incident review audit data from your device(s) |
| Verify that incident review audit data is normalized to the Common Information Model properly | | datamodel Incident_Management search |table app view user | Returns a list of events and the specific traffic data fields populated from your device(s) |
Additional Information
For more information about using the Incident Review Audit dashboard, see "Incident Review Audit dashboard" in the Splunk App for Enterprise Security User Manual.
Suppression Audit
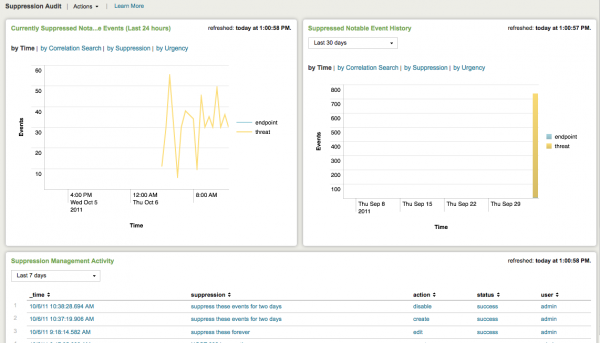
The Suppression Audit dashboard provides an overview of notable event suppression activity and shows how many events are being suppressed and by whom.
Need updated screenshot
Relevant data sources
The relevant data sources for the Suppression Audit dashboard includes notable event suppression indexed in Splunk.
How to configure this dashboard
1. Index relevant data sources from a device, application, or system in Splunk.
2. Map the data to the Incident_Management data model in this manual. See the Common Information Model Add-on Manual for more information on data models. The Common Information Model fields bunit and category are derived by automatic identity lookup, and do not need to be mapped directly.
3. Tag your data with "action" AND "status" AND "user" .
Dashboard description
Suppression Audit dashboard data is derived from the Incident_Management data model and accelerated automatically.
To verify that suppression audit data is present, use this search:
| datamodel Incident_Management Suppression_Audit search
To verify that events are being accelerated by the data model correctly, use this search (be careful not to search across all time):
| tstats summariesonly=true count from datamodel=Incident_Management by user
For more information on distributed namespaces, see "Verify that a data model namespace exists" in the troubleshooting section of this manual. See "Tscollect" and "Data Model" in the Splunk Search Reference Manual for more information about data models and namespaces.
Useful searches/Troubleshooting
| Troubleshooting Task | Search/Action | Expected Result |
|---|---|---|
| Verify that you have data from your network device(s) | sourcetype=<your_sourcetype_for_your_data> | Returns data from your network device(s). |
| Verify that suppression audit data is indexed in Splunk | tag=status or | datamodel Incident_Management Suppression_Audit search |
Returns all suppression audit data from your device(s) |
| Verify that suppression audit data is normalized to the Common Information Model properly | | datamodel Incident_Management Suppression_Audit search | table rule_id source suppression urgency | Returns a list of events and the specific traffic data fields populated from your device(s) |
Additional Information
For more information about using the Suppression Audit dashboard, see "Suppression Audit dashboard" in the Splunk App for Enterprise Security User Manual.
Data Model Audit
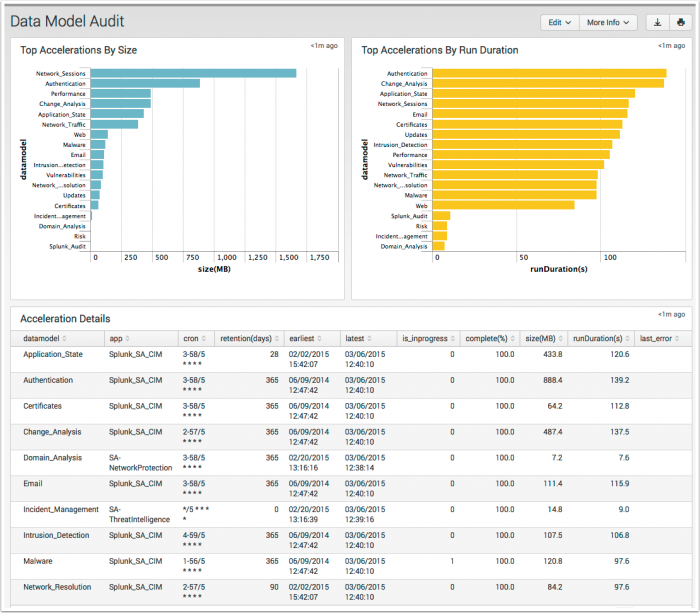
The Data Model Audit dashboard displays acceleration information about the data models available in your environment.
Relevant data sources
The Data Model Audit dashboard is populated by data from Splunk_Audit_Log data model.
How to configure this dashboard
1. Index relevant data sources from a device, application, or system in Splunk.
2. Map the data to the Splunk_Audit_Logs data model. See the Common Information Model Add-on Manual for more information. The Common Information Model fields bunit and category are derived by automatic identity lookup, and do not need to be mapped directly.
Dashboard description
Data Model Audit dashboard data is derived from the Splunk_Audit_Logs data model and accelerated automatically.
To verify that data model acceleration data is present, use this search:
| datamodel Splunk_Audit_Logs Datamodel_Acceleration search
To verify that events are being accelerated by the data model correctly, use this search (be careful not to search across all time):
| tstats summariesonly=true count from datamodel=Splunk_Audit_Logs by user
For more information on distributed namespaces, see "Verify that a data model namespace exists" in the troubleshooting section of this manual. See "Tscollect" and "Data Model" in the Splunk Search Reference Manual for more information about data models and namespaces.
Useful searches/Troubleshooting
| Troubleshooting Task | Search/Action | Expected Result |
|---|---|---|
| Verify that you have data from your network device(s) | sourcetype=<your_sourcetype_for_your_data> | Returns data from your network device(s). |
| Verify that access data is indexed in Splunk | | datamodel Splunk_Audit_Logs Datamodel_Acceleration search | Returns all data model acceleration data from your device(s) |
| Verify that traffic data is normalized to the Common Information Model properly | | datamodel Splunk_Audit_Logs Datamodel_Acceleration search | table datamodel app chron retention | Returns a list of data model acceleration events populated from your device(s) |
Additional Information
For more information about using the Data Model Audit dashboard, see "Data Model Audit dashboard" in the Splunk App for Enterprise Security User Manual.
Forwarder Audit
The Forwarder Audit dashboard detects forwarders that have failed and helps diagnose the cause of the failure, such as excessive resource utilization or forwarders not configured to start up when the host starts.
Need updated screenshot
This dashboard does not audit all forwarding activity, only information from systems that are configured as expected hosts in the Splunk App for Enterprise Security. To see all forwarding activity, use the Deployment Monitor app.
Relevant data sources
Relevant data sources for the Forwarder Audit dashboard include event activity data from all forwarders in your Splunk environment.
How to configure this dashboard
1. Index relevant data sources from a device, application, or system in Splunk.
2. Map the data to the Application_State data model. See the Common Information Model Add-on Manual for more information. The Common Information Model fields bunit and category are derived by automatic identity lookup, and do not need to be mapped directly.
3. Tag your data with "host"AND "app".
Dashboard description
Forwarder Audit dashboard data is derived from the Application_State data model and accelerated automatically.
To verify that forwarder data is present, use this search:
| datamodel Application_State Processes search
To verify that events are being accelerated by the data model correctly, use this search (be careful not to search across all time):
| tstats summariesonly=true count from datamodel=Application_State by user
For more information on distributed namespaces, see "Verify that a data model namespace exists" in the troubleshooting section of this manual. See "Tscollect" and "Data Model" in the Splunk Search Reference Manual for more information about data models and namespaces.
Useful searches/Troubleshooting
| Troubleshooting Task | Search/Action | Expected Result |
|---|---|---|
| Verify that you have data from your network device(s) | sourcetype=<your_sourcetype_for_your_data> | Returns data from your network device(s). |
| Verify that view audit data is indexed in Splunk | tag=host tag=app or | datamodel Application_State Processes search |
Returns all view audit data from your device(s) |
| Verify that incident review audit data is normalized to the Common Information Model properly | | datamodel Application_State Processes search |table app view user | Returns a list of events and the specific traffic data fields populated from your device(s) |
Additional Information
For more information about using the Forwarder Audit dashboard, see "Forwarder Audit dashboard" in the Splunk App for Enterprise Security User Manual.
Per-Panel Filter Audit
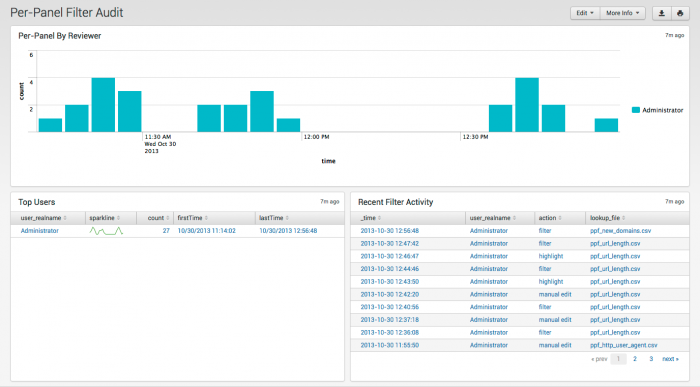
The Per-Panel Filter Audit dashboard provides visibility into the per-panel filtering currently in use.
Relevant data sources
Relevant data sources for the Per-Panel Filter Audit dashboard include per-panel filter data from all the Advanced Filters on the Enterprise Security dashboards.
How to configure this dashboard
1. Index relevant data sources from a device, application, or system in Splunk.
2. Map the data to the Change_Analysis data model. See the Common Information Model Add-on Manual for more information. The Common Information Model fields bunit and category are derived by automatic identity lookup, and do not need to be mapped directly.
3. Tag your data with "host"AND "app".
Dashboard description
Per-Panel Filter Audit dashboard data is derived from the Change_Analysis data model and accelerated automatically.
To verify that audit data is present, use this search:
| datamodel Change_Analysis All_Changes search
To verify that events are being accelerated by the data model correctly, use this search (be careful not to search across all time):
| tstats summariesonly=true count from datamodel=Change_Analysis by user
For more information on distributed namespaces, see "Verify that a data model namespace exists" in the troubleshooting section of this manual. See "Tscollect" and "Data Model" in the Splunk Search Reference Manual for more information about data models and namespaces.
Useful searches/Troubleshooting
| Troubleshooting Task | Search/Action | Expected Result |
|---|---|---|
| Verify that you have data from your network device(s) | sourcetype=<your_sourcetype_for_your_data> | Returns data from your network device(s). |
| Verify that view audit data is indexed in Splunk | tag=host tag=app or | datamodel Change_Analysis All_Changes search |
Returns all view audit data from your device(s) |
| Verify that incident review audit data is normalized to the Common Information Model properly | | datamodel Change_Analysis All_Changes search |table app view user | Returns a list of events and the specific traffic data fields populated from your device(s) |
Additional Information
For more information about using the Per-Panel Filter Audit dashboard, see "Per-Panel Filter Audit dashboard" in the Splunk App for Enterprise Security User Manual.
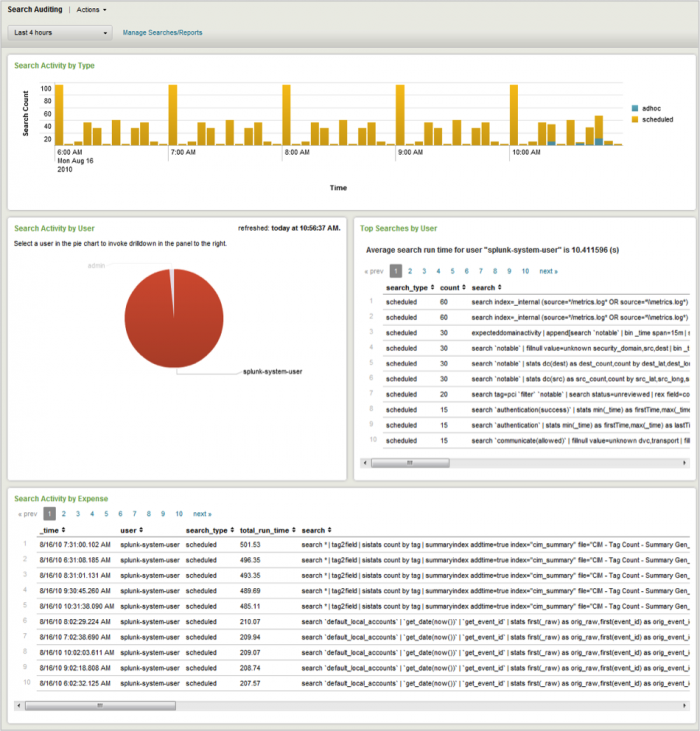
Search Audit
The Search Audit dashboard provides information about the searches currently being executed in Splunk.
Need new screen shot
Relevant data sources
Relevant data sources for the Search Audit dashboard are all view activity indexed in Splunk.
How to configure this dashboard
1. Index relevant data sources from a device, application, or system in Splunk.
2. Map the data to the Splunk_Audit_Logs data model in this manual. See the Common Information Model Add-on Manual for more information about data models. The Common Information Model fields bunit and category are derived by automatic identity lookup, and do not need to be mapped directly.
Dashboard description
Search Audit dashboard data is derived from the Splunk_Audit_Logs data model and accelerated automatically.
To verify that search audit data is present, use this search:
| datamodel Splunk_Audit_Logs Search_Activity search
To verify that events are being accelerated by the data model correctly, use this search (be careful not to search across all time):
| tstats summariesonly=true count from datamodel=Splunk_Audit_Logs by user
For more information on distributed namespaces, see "Verify that a data model namespace exists" in the troubleshooting section of this manual. See "Tscollect" and "Data Model" in the Splunk Search Reference Manual for more information about data models and namespaces.
Useful searches/Troubleshooting
| Troubleshooting Task | Search/Action | Expected Result |
|---|---|---|
| Verify that you have data from your network device(s) | sourcetype=<your_sourcetype_for_your_data> | Returns data from your network device(s). |
| Verify that search activity data is indexed in Splunk | | datamodel Splunk_Audit_Logs Search_Activity search | Returns all search activity data from your device(s) |
| Verify that search activity data is normalized to the Common Information Model properly | | datamodel Splunk_Audit_Logs Search_Activity search |table action app src src_user dest user | Returns a list of search activity and the specific search data fields populated from your device(s) |
Additional Information
For more information about using the Search Audit dashboard, see "Search Audit dashboard" in the Splunk for Enterprise Security User Manual.
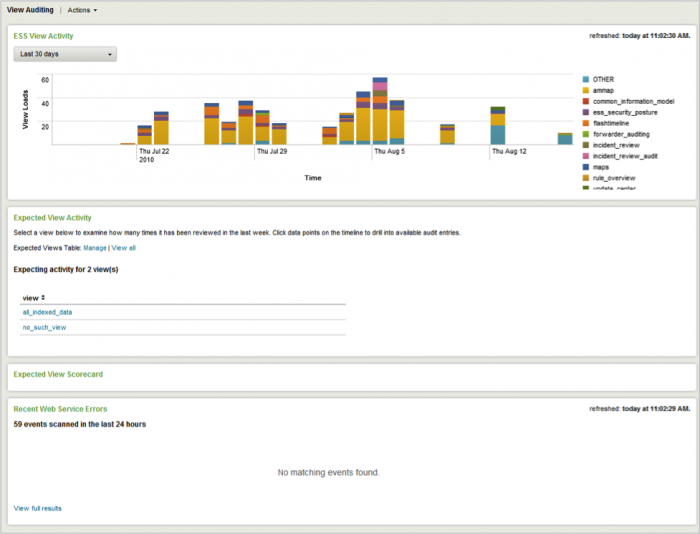
View Audit
The View Audit dashboard provides information about the access frequency of the Enterprise Security views.
Need new screen shot
Relevant data sources
Relevant data sources for the View Audit dashboard include any activity involving dashboards in the Splunk App for Enterprise Security.
How to configure this dashboard
1. Index relevant data sources from a device, application, or system in Splunk.
2. Map the data to the Splunk_Audit_Logs data model. See the Common Information Model Add-on Manual for more information. The Common Information Model fields bunit and category are derived by automatic identity lookup, and do not need to be mapped directly.
Dashboard description
View Audit dashboard data is derived from the Splunk_Audit_Logs data model and accelerated automatically.
To verify that traffic data is present, use this search:
| datamodel Splunk_Audit_Logs Search_Activity search
To verify that events are being accelerated by the data model correctly, use this search (be careful not to search across all time):
| tstats summariesonly=true count from datamodel=Splunk_Audit_Logs by user
For more information on distributed namespaces, see "Verify that a data model namespace exists" in the troubleshooting section of this manual. See "Tscollect" and "Data Model" in the Splunk Search Reference Manual for more information about data models and namespaces.
Useful searches/Troubleshooting
| Troubleshooting Task | Search/Action | Expected Result |
|---|---|---|
| Verify that you have data from your network device(s) | sourcetype=<your_sourcetype_for_your_data> | Returns data from your network device(s). |
| Verify that view audit data is indexed in Splunk | | datamodel Splunk_Audit_Logs Search_Activity search | Returns all view audit data from your device(s) |
| Verify that traffic data is normalized to the Common Information Model properly | | datamodel Splunk_Audit_Logs Search_Activity search | table view user app | Returns a list of events and the specific view data fields populated from your device(s) |
Additional Information
For more information about using the View Audit dashboard, see "View Audit dashboard" in the Splunk App for Enterprise Security User Manual.
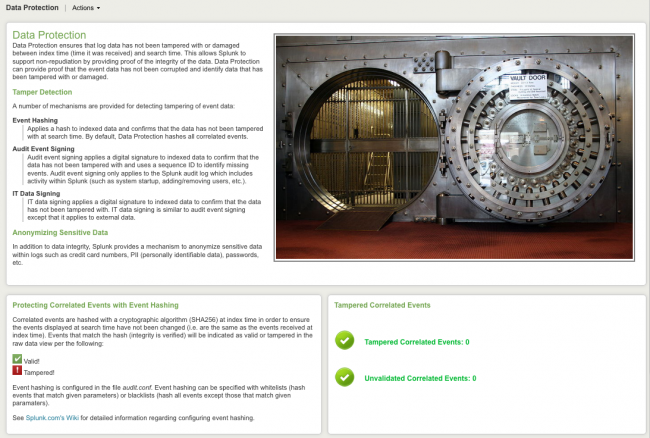
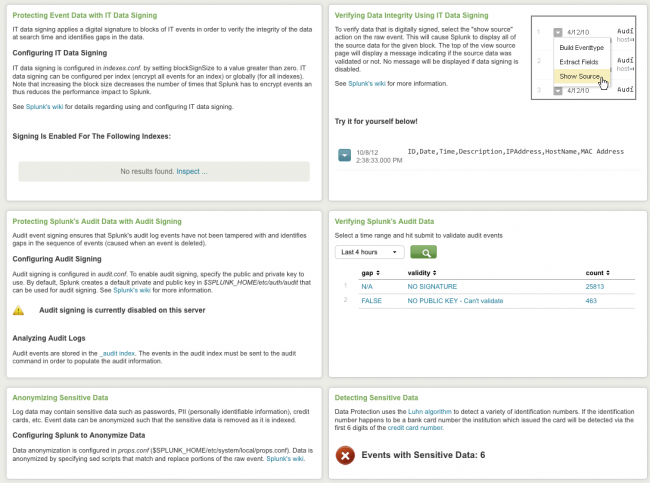
Data Protection
The Data Protection dashboard helps to validate the security of your data and provide an overview of the data protection mechanisms used by the Splunk App for Enterprise Security.
Need updated screenshot
Relevant data sources
Relevant data sources for the Data Protection dashboard include data from any security devices in your network and event activity indexed by Splunk.
How to configure this dashboard
1. Index relevant data sources from a device, application, or system in Splunk.
2. Map the data to the Splunk_Audit_Logs data model in this manual. See the Common Information Model Add-on Manual for more information about data models. The Common Information Model fields bunit and category are derived by automatic identity lookup, and do not need to be mapped directly.
Dashboard description
Data Protection dashboard data is derived from the Splunk_Audit_Logs data model and accelerated automatically.
To verify that data protection data is present, use this search:
| datamodel Splunk_Audit_Logs View_Activity search
To verify that events are being accelerated by the data model correctly, use this search (be careful not to search across all time):
| tstats summariesonly=true count from datamodel=Splunk_Audit_Logs by user
For more information on distributed namespaces, see "Verify that a data model namespace exists" in the troubleshooting section of this manual. See "Tscollect" and "Data Model" in the Splunk Search Reference Manual for more information about data models and namespaces.
Useful searches/Troubleshooting
| Troubleshooting Task | Search/Action | Expected Result |
|---|---|---|
| Verify that you have data from your network device(s) | sourcetype=<your_sourcetype_for_your_data> | Returns data from your network device(s). |
| Verify that data protection information is indexed in Splunk | | datamodel Splunk_Audit_Logs View_Activity search | Returns all data protection data from your device(s) |
| Verify that data protection data is normalized to the Common Information Model properly | | datamodel Splunk_Audit_Logs View_Activity search | table app view user | Returns a list of events and the specific traffic data fields populated from your device(s) |
Additional Information
For more information about the Data Protection dashboard, see "Data Protection dashboard" in the Splunk App for Enterprise Security User Manual.
| Identity dashboards | Additional dashboards |
This documentation applies to the following versions of Splunk® Enterprise Security: 3.0, 3.0.1

 Download manual
Feedback submitted, thanks!