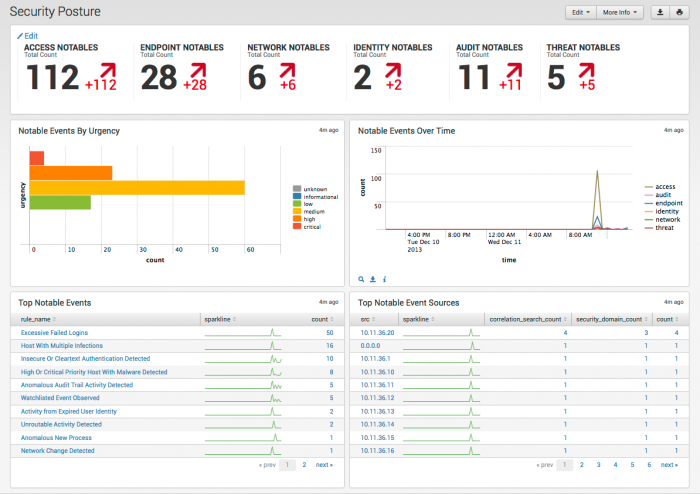
Security Posture dashboard
The Security Posture dashboard is the overview screen for the Splunk App for Enterprise Security. It provides a high-level view into the notable events across all domains in your deployment.
This dashboard shows all events from the past 24 hours, with trends over the past 24 hours, and auto-updates in real time providing real-time information on events.
This dashboard is populated by information from the other domains and dashboards and does not need to be configured.
Key indicators
Key indicators at the top of the Security Posture dashboard show selected notable events in your deployment. Quickly see trends in notable event activity over the past 24 hours. Choose which indicators to include and rearrange them in the order you prefer. See "Key indicators" in this manual for more information.
| Configure log review settings | Incident Review dashboard |
This documentation applies to the following versions of Splunk® Enterprise Security: 3.0, 3.0.1

 Download manual
Feedback submitted, thanks!