Event Investigator dashboards
| Information on this page is currently a work in progress; expect near-term updates. |
There are two Event Investigator dashboards - the Asset Investigator and Identity Investigator. These dashboards use swim lanes and heat maps to display event data related to assets and identities in your Enterprise Security deployment. Right-click on events with identity or asset information from various places in the Splunk App for Enterprise Security to go the appropriate investigator dashboard.
Asset Investigator
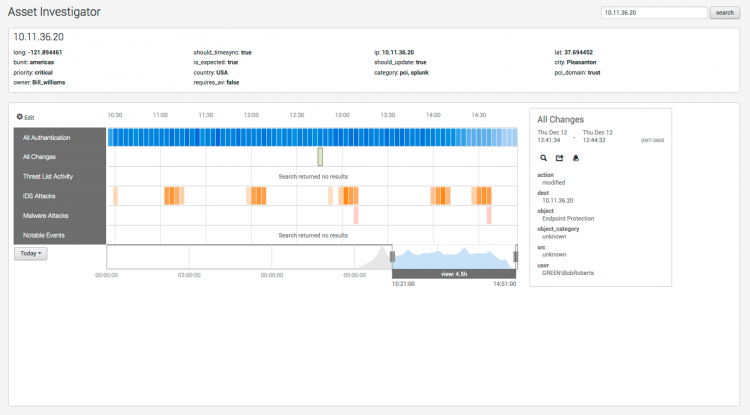
The Asset Investigator dashboard provides an overview of all activity related to your assets (network devices, desktop computers, servers, and so on).
Need a new screenshot with better data.
Swim lanes
A default set of swim lanes displays the types of events associated with the selected asset. You can modify these to create a custom display.
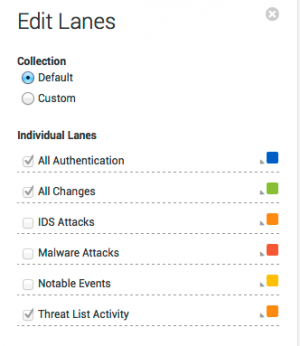
Click Edit at the top of the swim lane panel to modify the swim lanes displayed in the Asset Investigator dashboard. The editor can be used to change the group of swim lanes (default or custom), the order of the lanes, or the color used to represent events for that lane.
Add asset information
See "Identity Manager" in this manual for information about adding asset and identity information to the Splunk App for Enterprise Security.
Relevant data sources
Relevant data sources for this dashboard include any events associated with assets that are part of your Enterprise Security environment.
How to configure this dashboard
1. Index relevant data sources from a device, application, or system in Splunk. See "Identity Manager" in this manual for more information.
2. Map the data to the Assets and Identities data model. See the Assets and Identities topic for more information. The Common Information Model fields bunit and category are derived by automatic identity lookup, and do not need to be mapped directly.
Dashboard description
Asset Investigator dashboard data is derived from the Assets and Identities data model. To verify that asset information is available, use this search:
| datamodel Assets_And_Identities All_Assets search
For more information on distributed namespaces, see "Verify that a data model namespace exists"" in the troubleshooting section of this manual. See "Datamodel" and "Tscollect" in the Splunk Search Reference Manual for more information about datamodels and namespaces.
Useful searches/Troubleshooting
| Troubleshooting Task | Search/Action | Expected Result |
|---|---|---|
| Verify that you have access data from your network device(s) | sourcetype=<your_sourcetype_for_your_data> | Returns data from your network device(s). |
| Verify that access data is normalized to the Common Information Model properly | | datamodel Assets And Identities All_Identities search | table sourcetype action app src src_user dest user | Returns a list of events and the specific access activity fields of data populated from your device(s) |
Additional Information
For more information about using the Asset Investigator dashboard, see "Asset Investigator dashboard" in the Splunk App for Enterprise Security User Manual.
Identity Investigator
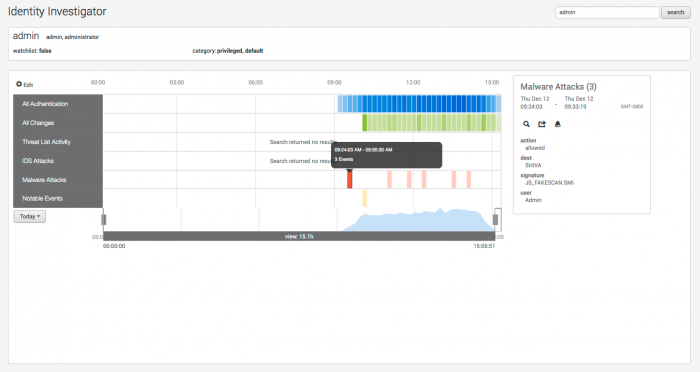
Use the Identity Investigator dashboard to view events related to an identity.
Need a new screenshot with better data
Hover over an event in a swim lane for summary information. Click on a item in the heat map to show more information about that event (or group of events).
Swim lanes
A default set of swim lanes displays the types of events associated with the selected asset. You can modify these to create a custom display.
Click Edit at the top of the swim lane panel to modify the swim lanes displayed in the Identity Investigator dashboard. The editor can be used to change the group of swim lanes (default or custom), the order of the lanes, or the color used to represent events for that lane.
Add identity information
See "Identity Manager" in this manual for information about adding asset and identity information to the Splunk App for Enterprise Security.
Relevant data sources
Relevant data sources for this dashboard include any events associated with identities that are part of your Enterprise Security environment.
How to configure this dashboard
1. Index relevant data sources from a device, application, or system in Splunk. See "Identity Manager" in this manual for more information.
2. Map the data to the Assets and Identities data model. See the Assets and Identities topic for more information. The Common Information Model fields bunit and category are derived by automatic identity lookup, and do not need to be mapped directly.
Dashboard description
Identity Investigator dashboard data is derived from the Assets and Identities data model. To verify that identity information is available, use this search:
| datamodel Assets_And_Identities All_Identities search
For more information on distributed namespaces, see "Verify that a data model namespace exists"" in the troubleshooting section of this manual. See "Datamodel" and "Tscollect" in the Splunk Search Reference Manual for more information about datamodels and namespaces.
Useful searches/Troubleshooting
| Troubleshooting Task | Search/Action | Expected Result |
|---|---|---|
| Verify that you have data from your network device(s) | sourcetype=<your_sourcetype_for_your_data> | Returns data from your network device(s). |
| Verify that identity data is normalized to the Common Information Model properly | | datamodel Assets And Identities All_Identities search | table sourcetype action app src src_user dest user | Returns a list of events and the specific access activity for fields of identity data populated from your device(s) |
Additional Information
For more information about using the Identity Investigator dashboard, see "Identity Investigator dashboard" in the Splunk App for Enterprise Security User Manual.
| Predictive Analytics dashboard | Advanced Threat dashboards |
This documentation applies to the following versions of Splunk® Enterprise Security: 3.0, 3.0.1


 Download manual
Feedback submitted, thanks!