Modify correlation searches
The default correlation searches are designed to support a range of environments and purposes. You may wish to further edit the searches, for example, to restrict them to only look at a subset of the data (for example, if you want the correlation search to function for your web servers, a particular business unit, etc.).
Edit a correlation search
The correlation search can be edited by changing the saved search associated with it.
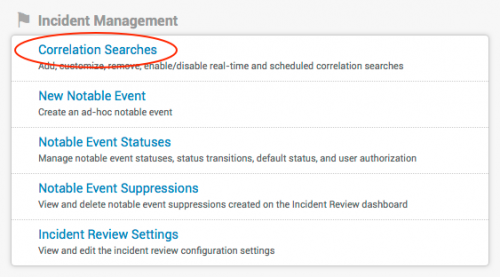
1. Go to Configure > Incident Handling > Correlation Searches.
2. Click Correlation Searches and click the name of the correlation search to edit. The saved search editor will display the selected correlation search.
3. Generally, it is a good idea to copy the saved search into the search view so that you verify the results and make sure the search is correct. To do this, copy the text in the search entry box, then click Back to Enterprise Security Suite and navigate to the Search dashboard (Resources > Search). Then paste the search in the search bar.
4. Formulate the search according to your requirements.
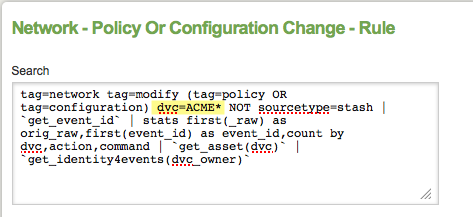
For example, if you wanted to edit the Network - Policy Or Configuration Change correlation search to trigger only when the host starts with "ACME" then you may edit the search by adding "dvc=ACME*" to the search (highlighted in yellow):
5. Click the magnifying glass (![]() ) to run the search and ensure the results are as expected.
) to run the search and ensure the results are as expected.
6. Copy the correctly modified search string. You may want to copy it to a text editor to ensure that you have it available.
7. Return to Configure > Incident Review > Correlation Searches and select your search again.
8. Paste the updated search into the search entry box or type in the appropriate modifications.
9. Click Save.
When you modify correlation searches, make sure not to alter statements that are required for the search to run properly:
- Do not remove the
get_assetmacro. This macro is used to retrieve the asset information for the event.
- Do not change the start time, end time, or frequency of the correlation searches. Some correlation searches rely on summary indexes that must be modified if the search frequency is changed. Changing the saved search frequency without changing the associated summary index may cause the correlation search to be out-of-sync and thus provide incorrect results.
Change time window for notable event drill-down
You can modify the time window for the drill-down link on notable events. This link shows all raw events associated with the notable event.
By default, drill-down from a notable event displays the status of the related events at the time you drill down, not just the events that occurred before the notable event was detected. In particular, drilling down from a notable event may reveal more events than the count field in the notable indicates.
For example, a particular notable event may be created as soon as 100 authentication failures occur. However, by the time you drill down, you might see 200 authentication failures, 100 of which occurred after the initial creation of the event.
To modify this behavior, you need to modify the drill-down-related fields for the correlation search that defines the notable event. These fields define and name the search that is executed when the user clicks the drill-down link. You can edit this search in Configure or directly in the configuration file.
To edit the search:
1. Go to Configure > Correlation Searches.
2. Click the name of the search whose drill-down behavior you want to change.
3. Locate Add fields near the bottom of the window.
4. To change the time window of the search, edit the drill-down_search field. For example, here is the default drill-down_search field for a correlation search:
src=$src$ `authentication`
To modify this to show only the events from the last 24 hours, you would add the following:
src=$src$ `authentication` earliest=-24h
5. To change the description that is displayed on the Incident Review dashboard, edit the drill-down_name field. For example, here is the default description for the above drilldown:
View all login attempts by $src$
You should edit it to reflect the selected time window:
View all login attempts by $src$ within the last 24 hours
You can also edit the search directly in the configuration file. In this case, you need to modify the values for the following fields:
action.summary_index.drilldown_search: sets the search string used for the drill-down
action.summary_index.drilldown_name:sets the description displayed on the Incident Review dashboard.
See "Create a correlation search" for more information about using the configuration files for correlation searches.
Create a correlation search
You can create your own correlation searches to generate notable events that you want to have stored in the notable index and to appear on the Incident Review dashboard. To do this, you need to create a Splunk saved search that finds the pattern you want and then set it up to work correctly with Enterprise Security.
Note: If you use the correlation search editor to create a new correlation search, see "Suppress notable events from new correlation searches" for information on how suppress these notable events.
Create and name your base search
1. Determine a name for your search. This name is used in the search string, so it is important to define it ahead of time. To make it easier to locate and identify correlation searches, Enterprise Security uses the following convention for correlation searches:
Domain - Descriptive Name - Rule
Example: A correlation search that looks for a large number of failed logins might be given the name:
Access - Excessive Failed Logins - Rule
Note: There is a 64 character maximum for search names when using the Correlation Search editor UI.
2. Next, create a search that will identify the events that you want. This may take some trial and error. Typically you will go to the Search dashboard (Resources > Search) and try various search strings, building up a string that selects all the patterns you want, while excluding patterns you don’t want.
Example: The following search identifies 6 or more failed authentication events per app and source, where "app" refers to the application used to authenticate. For example, "win:local" refers to the local authentication performed on a Windows system (using the keyboard) and "win:remote" refers to a remote API (such as telnet).
`authentication(failure)` | stats count,dc(user) as user_count,dc(dest) as dest_count by app,src | where count>=6
Modify the search
Once you have a search that works the way you want, you need to modify it to save the correct set of fields in the "notable" index. The Incident Review dashboard requires that certain fields are present in the notable event for the event to be rendered correctly, and for drill-down features to be enabled.
Follow the steps in this section to ensure the your correlation search is configured correctly. The primary consideration is whether the correlation search is based upon raw events or on statistical data produced by a Splunk reporting command
(for example, stats, chart, timechart).
Raw event searches
If the correlation search is based on raw events without aggregation, you need to rename certain fields so that the notable event will be rendered properly in the Incident Review dashboard.
To do this:
1. Append the `get_event_id` macro to the end of your search string to generate an event ID (field name=event_id) and event hashcode (field name=event_hash) for each original event involved in triggering the notable event. The unique identifiers created will be used to drill-down from the notable event back to the raw event from the Incident Review dashboard.
2. Append the `map_notable_fields` macro to the end of your search string to rename fields. This macro conducts several operations that clean up raw event data in preparation for the Incident Review dashboard:
a. Several fields are renamed with the prefix orig_, including but not limited to:
- the
_rawfield is renamed toorig_raw. (Splunk's summary indexing processor requires that the_rawfield be renamed for proper indexing of notable events.) - the
_timefield is renamed toorig_time; the summary indexing processor will automatically add the time that the correlation search is executing to the notable event - the
event_hashfield which is used to enable drill-down - the
event_idfield which uniquely identifies the original event
b. punct and date::* fields are removed
It is important to use both these macros in the order shown, since the Incident Review dashboard expects fields to have the correct prefix.
Note: The orig_event_id field created by the `get_event_id` | `map_notable_fields` combination of macros can also be used as a throttling parameter to ensure notable event uniqueness, if it cannot be ensured based on other throttling parameters.
For instance, in the following search in SA-ThreatIntelligence (some lines have been skipped), notable event throttling is based on a combination of source, sourcetype, and host:
[Threat - Watchlisted Events - Rule]
alert.suppress.fields = source,sourcetype,host
search = tag=watchlist NOT sourcetype=stash | `get_event_id` | `map_notable_fields`
If multiple "watchlisted" events occur from the same source, sourcetype, and host - for instance, if multiple virus infections occurred on the same machine - they would not be regarded as distinct notable events by this correlation search. In this case, we could add the orig_event_id field as a suppression parameter to individuate the notable events.
[Threat - Watchlisted Events - Rule]
alert.suppress.fields = source,sourcetype,host,orig_event_id
search = tag=watchlist NOT sourcetype=stash | `get_event_id` | `map_notable_fields`
Reporting searches
If the search concludes with a reporting command such as stats, it can typically be used to construct a correlation search directly with no additional modification, since the stats command, and related commands, already do the minimal processing necessary including removal of the _raw field.
Note: Notable events that summarize multiple raw events, enable drill-down based on the drilldown_search parameter in correlationsearches.conf and not on an orig_event_hash field value, since it would not make sense to drill-down to a single event from a correlation search that aggregated multiple events.
| Correlation searches | New notable event |
This documentation applies to the following versions of Splunk® Enterprise Security: 3.0, 3.0.1


 Download manual
Feedback submitted, thanks!