Network Traffic Activity
This report provides a six-month rolling view of network traffic activity between PCI domains.
This report looks at traffic data produced by firewalls, routers, switches, and any other device that produces network traffic data. You can modify and customize the report by using different filters.
Relevant data sources
Relevant data sources for this report include any device that creates network traffic activity, typically firewalls (for example, Palo Alto, Checkpoint, Cisco ASA, and so on).
How to configure this report
1. Index firewall data activity in Splunk Enterprise.
2. Map the data to the following Common Information Model fields:
host,action,dvc,rule,transport,src,src_port,dest,dest_port,vendor_product
3. Set the category column for each asset in the Asset table to "pci" and/or "cardholder" as applicable.
4. Set the pci_domain column for each asset in the Asset table to {dmz|trust|untrust|cardholder|wireless}.
5. Set the is_secure and is_prohibited columns of the prohibited traffic list to {true|false}.
Mapping examples:
- The
actionfield shows eitherallowedorblockedtraffic. - The
eventtypesfor traffic-related data are tagged withcommunicateandnetwork
Report description
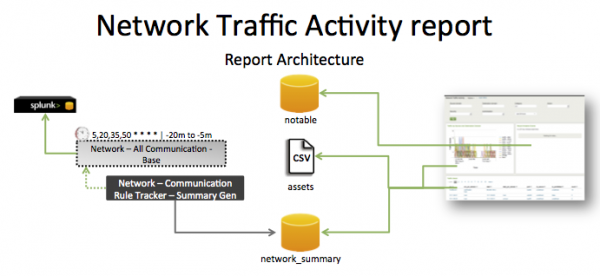
The data in the Network Traffic Activity report is populated by an ad hoc search that runs against the network_summary summary index. This index is created by the Network - All Communication - Summary Gen saved search, which is a post-process task of the Network - All Communication - Base saved search.
This search runs on a 15 minute cycle and looks at 20 minutes of data.
| Schedule: | 5,20,35,50 * * * * | Runs on a 15 offset minute window. |
| Report Window: | -20m@m to -5m@m | Looks at 15 minutes of data. |
Note: The report window stops at 5 minutes ago because some data sources may not have provided complete data in a more recent time frame.
Useful searches/Troubleshooting
| Troubleshooting Task | Search/Action | Expected Result |
|---|---|---|
| Verify that you have data from your network devices. | sourcetype=<your_sourcetype_for_your_data> | Returns data from your network devices. |
| Verify that network activity data has been indexed in Splunk Enterprise. | tag=network tag=communicate or `communicate` |
Returns all network traffic data from your network devices. |
| Verify that the fields are normalized to the Common Information Model. | `communicate` | fields sourcetype, action, dvc, rule, transport, src, dest | Returns a list of events and the specific network traffic fields of data populated from your devices. |
| Verify that the summary index needed by the report is populated. | `get_summary(network_summary,"Network - All Communication - Summary Gen")` | Returns data in the network_summary index. |
Additional information
- The
Network – Communication – Lookup Genis a post-process task. You can find the details of this search in the$SPLUNK_HOME/etc/apps/SA-NetworkProtection/default/postprocess.conffile.
- The
Network – Communication – Summary Genis a post-process task. You can find the details of this search in the$SPLUNK_HOME/etc/apps/SA-NetworkProtection/default/postprocess.conffile.
| Firewall Rule Activity | Default Account Access |
This documentation applies to the following versions of Splunk® App for PCI Compliance: 2.1.1

 Download manual
Feedback submitted, thanks!