Prohibited Services
This report looks at prohibited services data produced by the services_tracker. It reports on systems with prohibited services installed and running. Compromises often happen because of unused or insecure service and ports on systems within the cardholder environment or systems that have a communication path to cardholder systems.
These services and ports can have known vulnerabilities. A security hardening policy should be defined that clearly defines what services and protocols are allowed to run on each system. Organizations should test those systems periodically to ensure that they are patched appropriately and unauthorized services are disabled.
Relevant data sources
Relevant data sources for this report include Service, Process, and Port data (linux_base, Splunk_TA_windows).
How to configure this report
1. Index process, service, and/or port data in Splunk Enterprise.
2. Map the data to the following [[Documentation:Splunk:Knowledge:UnderstandandusetheCommonInformationModelCommon Information Model]] fields:
- Services fields:
dest, app, StartMode - Process fields:
dest, app, PercentProcessorTime, UsedMBytes - Port fields:
dest,dest_port,transport
Note: *_base/TA-nix and Splunk_TA_Windows do this already.
3. Configure the is_prohibited column in the Interesting [ports|processes|ports] lists with any service, process, or port considered prohibited.
Report description
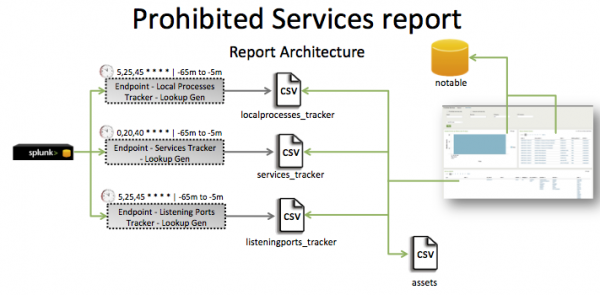
The data in the Prohibited Services report is populated by three services_tracker lookups. One lookup is generated by the Endpoint - Local Processes - Lookup Gen saved search, a second by the Endpoint - Services Tracker - Lookup Gen saved search, and the third by the Endpoint - Listening Ports Tracker- Lookup Gen saved search. The `localprocesses_tracker`, `services_tracker` macros correlate process data with the asset and identity tables to pull in additional information.
This report includes three searches: Endpoint - Local Processes - Lookup Gen, Endpoint - Services Tracker - Lookup Gen, and Endpoint - Listening Ports Tracker- Lookup Gen.
The Endpoint - Local Processes - Lookup Gen search runs on an offset 20 minute cycle and looks at 60 minutes of data.
| Schedule | 5,25,45 * * * * | Runs on a 20 minute offset window. |
| Report window | -65m@m to -5m@m | Looks at 60 minutes of data. |
The Endpoint - Services Tracker - Lookup Gen search runs on an offset 20 minute schedule and looks at 60 minutes of data.
| Schedule | 0,20,40 * * * * | Runs on a 20 minute offset window. |
| Report window | -65m@m to -5m@m | Looks at 60 minutes of data. |
The Endpoint - Listening Ports Tracker- Lookup Gen runs on an 20 offset minute cycle and looks at 60 minutes of data.
| Schedule | 5,25,45 * * * * | Runs on a 20 minute offset window. |
| Report window | -65m@m to -5m@m | Looks at 60 minutes of data. |
See the Report Architecture graphic for details.
Note: The report window stops at 5 minutes ago, because some data sources might not have provided complete data in a more recent time frame.
Useful searches/Troubleshooting
| Troubleshooting Task | Search/Action | Expected Result |
|---|---|---|
| Verify that service, process, and/or port information has been indexed. | sourcetype=<expected_st> | Returns data from service, process, and/or port. For example, sourcetype=WMI:Service. |
| Verify that the service data has been normalized at search time correctly. | sourcetype=“*Service” | table dest, app, StartMode or `service` | table dest, app, StartMode |
Returns a table of all service events. |
| Verify that the process data has been normalized at search time correctly. | sourcetype="*:LocalProcesses“ | table dest, app, PercentProcessorTime, UsedMBytes | Returns a table of local process data. |
| Verify that the port data has been normalized at search time correctly. | tag=listening tag=port | table dest,dest_port,transport or | `listeningports` | table dest,dest_port,transport |
Returns a table of port data. |
| Verify that the service tracker file is getting created correctly. | | inputlookup append=T services_tracker or `services_tracker` |
Returns data in the service tracker. |
| Verify that the process tracker file is getting created correctly. | | inputlookup append=T services_tracker or | `localprocesses_tracker` |
Returns local processes data. |
| Verify that the port tracker file is getting created correctly. | | inputlookup append=T localprocesses_tracker or `listeningports_tracker` |
Returns data in the port tracker. |
| Verify that the Interesting Services, Interesting Processes, and/or Interesting Ports lookups are populated with expected prohibited values. | Open the lists in Configure > Lists and Lookups > Interesting [ ports | processes | services ] and verify that the is_prohibited column is set to “true”.
|
Additional information
This report uses default source types that ship with windows TA + linux_base deployment package.
Tracker files for this report are located:
$SPLUNK_HOME/etc/apps/SA-EndpointProtection/lookups/listeningports_tracker.csv$SPLUNK_HOME/etc/apps/SA-EndpointProtection/lookups/services_tracker.csv$SPLUNK_HOME/etc/apps/SA-EndpointProtection/lookups/localprocesses_tracker.csv
| Primary Functions | System Misconfigurations |
This documentation applies to the following versions of Splunk® App for PCI Compliance: 2.1.1

 Download manual
Feedback submitted, thanks!