カスタムタグによるフィルタリングとトラブルシューティング 🔗
カスタムタグを作成して、Splunk RUMのTag Spotlightでのフィルタリングおよびトラブルシューティングの機能を向上させます。最初にカスタムスパンタグを作成し、次にそのスパンタグにMetricSetを追加してインデックス化します。スパンタグにMetricSetを追加すると、インデックス済みスパンタグに関連するすべての機能を利用できます。
キーコンセプト 🔗
スパンタグ、インデックス済みスパンタグ、およびMetricSetsの相互関係。
MetricSets 🔗
MetricSetsは、特定のメトリクスのパフォーマンスを経時的に追跡するために使用できるメトリック時系列(MTS)です。
例:カスタムプロセスの追跡 🔗
カスタムタグのように組織にとって意味のある独自のタグを追加することで、結果を絞り込み、最も適切なインサイトを収集することができます。カスタムスパンタグは、組織固有のプロセスを追跡する際に特に役立ちます。
以下は、スパンタグとして使用できるものの一部の例です:
カスタマーサポートティアやロイヤルティレベル
部門
施設の内部の地理位置
支店の所在地
Tag Spotlightにカスタムタグを追加する 🔗
このタスクを実行するには、管理者である必要があります。Tag Spotlightにカスタムタグを追加するには、以下の手順に従います:
スパンを作成する の説明にしたがって、スパンタグを追加します。スパンに属性を追加するには、RUMのAPIの メソッド を参照してください。
MetricSetsの設定ページに移動するには、2つの方法があります。どちらかを選択してください:
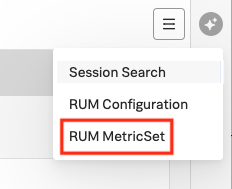
Splunk RUMで、以下のスクリーンショットに示すように、MetricSetsの設定ページから RUM MetricSet を選択する。
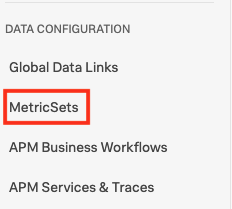
左のナビゲーションメニューから、設定、MetricSets、RUM タブの順に選択する。
インデックス化するタグを選択して、カーディナリティアナライザーをトリガーします。カーディナリティチェックにパスしたら、MetricSetの追加 を選択し、チェックマークで確定します。
トラブルシューティング 🔗
カーディナリティ分析が失敗した場合は、エンタイトルメントを超えている可能性があります。
MetricSetsでは高いカーディナリティを回避する 🔗
妥当なカーディナリティのタグを選択してください。userIDやsessionIDのようなタグは、組織内のユーザーやアプリケーションへの訪問者が一意の値を持つため、カーディナリティが高くなります。各ユーザーIDのトラブルシューティングMetricSetを作成することは、パフォーマンスにとって最適ではありません。高カーディナリティのIDベースのタグについては、完全忠実セッション検索がより適したオプションです。Splunk RUM のタグでデータをフィルタリングする を参照してください。
高カーディナリティのMetricSetsは、組織の制限 Splunk RUMのシステム制限 にも影響します。制限は、サブスクリプション(Enterprise、Standard)によって決まります。各サブスクリプションタイプに関する詳細は、Splunk RUMの料金体系 を参照してください。