Infrastructure Monitoringをセットアップする 🔗
このページでは、一般的なデータソースから Splunk Observability Cloud にメトリクスを送信するための概要を説明します。
インテグレーションとは、Splunk Observability Cloud をサードパーティのサービスに接続する、Splunk Observability Cloud の設定可能なコンポーネントです。ほとんどのインテグレーションはサードパーティのデータサービスを接続しますが、Splunk Observability Cloud は SSO と通知のインテグレーションも提供します。インフラストラクチャからメトリクスを収集するために、Splunk Observability Cloud でインテグレーションを設定することができます。インフラストラクチャやサービスからログやトレースも収集したい場合は、Splunk Observability Cloud にデータを取り込む ガイドを参照してください。
各インテグレーションは、サポートされているデータタイプを収集するためのステップバイステップのプロ セスを説明します。任意のデータソースのインテグレーションを構成するには、ナビゲーションメニュー > データ管理 > 利用可能なインテグレーション を選択します。
以下の手順では、インフラストラクチャからメトリクスを収集するインテグレーションを構成する方法を説明します。
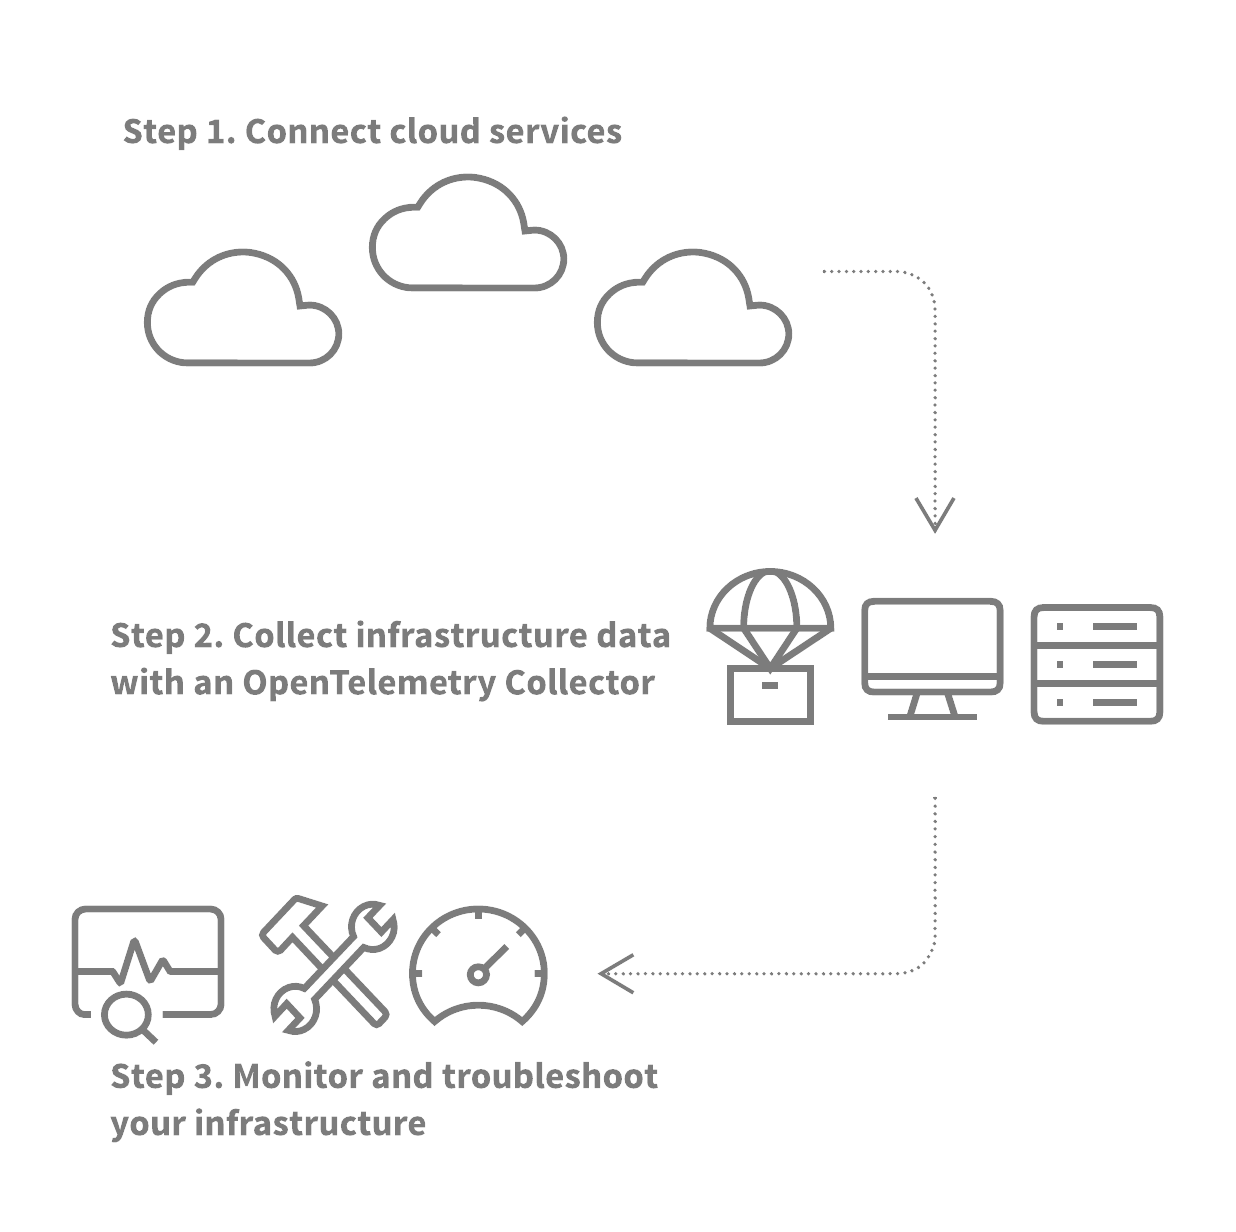
ステップ1. クラウドサービスを接続する 🔗
注意: Splunk Observability Cloudでデータを収集するインテグレーションを設定するには、管理者である必要があります。
AWS、GCP、またはAzureでサポートされているクラウドサービスからデータを収集するには、Splunk Observability Cloudをクラウドサービスプロバイダに接続します。クラウドサービス内で実行されるホストやKubernetesクラスタを監視するためにクラウドサービスに接続する必要はありませんが、クラウドアカウントを接続することがクラウドメタデータを収集する唯一の方法です。
クラウドサービスを使用しない場合、またはSplunk Observability Cloudによるデータ収集やメタデータの同期を希望しない場合は、次のステップに進んでください。
Splunk Observability Cloudは、AWSアカウントからログとメトリクスの両方のデータを収集します。AWSアカウントからメトリクスのみを収集する予定の場合は、CloudWatch Metricsからのみデータを収集するように選択します。
クラウドサービスに接続するには、ナビゲーションメニュー > データ管理 > 利用可能なインテグレーション を選択し、接続したいクラウドサービスを検索します。
クラウドサービスをSplunk Observability Cloudに接続する詳細な手順については、以下のページを参照してください:
ステップ 2. Splunk Distribution of OpenTelemetry Collectorを使ってインフラストラクチャデータを収集する 🔗
Splunk Observability Cloud は、Kubernetes、Linux、Windowsのインテグレーションをサポートしています。これらのデータソース用のインテグレーションは、Splunk Distribution of OpenTelemetry Collector をデプロイして、ホストやコンテナからSplunk Observability Cloudにメトリクスをエクスポートするのに役立ちます。
Splunk Distribution of OpenTelemetry Collector の使用はオプションですが、Splunk Distribution of OpenTelemetry Collector を使用すると、クラウドインテグレーションよりも高解像度のデータを取得できます。
インフラストラクチャリソースからメトリクスを収集するには、ナビゲーションメニュー > データ管理 > 利用可能なインテグレーション を選択し、メトリクスを収集したいホストタイプまたはコンテナ化環境を検索します。
ホストまたはコンテナのメトリクスをSplunk Observability Cloudに送信する方法については、以下のページを参照してください:
ステップ3. インフラストラクチャを監視およびトラブルシューティングする 🔗
ステップ1と2では、サポートされているクラウドサービス、ホストおよびコンテナからSplunk Observability Cloudにデータを送信しました。このデータは、インフラストラクチャの監視とトラブルシューティングを開始するために使用できるインフラストラクチャの概要などのビルトインエクスペリエンスに入力されます。
インフラストラクチャの概要を表示するには、ナビゲーションメニュー > インフラストラクチャ を選択します。このページから、次の表に示すようにインフラストラクチャを表示できます。
Splunk Observability Cloud は、以下のホストとアプリケーションのモニター に対しても、メトリクスとその他のデータを提供します。
カテゴリ |
リソース |
説明 |
|---|---|---|
パブリッククラウド |
サポートされているすべてのクラウドサービスについて、主要なメトリクスを表示し、インシデントを可視化します。インフラストラクチャの概要では、クラウドサービスごとにデフォルトのダッシュボードが用意されています。例えば、AWS EC2インスタンスとAWS EBSインスタンスには個別のダッシュボードがあります。 |
|
コンテナ |
Kubernetesインフラストラクチャの主要メトリクスを表示し、インシデントをクラスタ、ノード、ポッド、コンテナレベルで可視化します。 |
|
My Data Center |
Splunk Observability Cloudでデータを収集したすべてのLinuxおよびWindowsホストの主要メトリクスを表示し、インシデントを可視化します。 |