Dotcom monitor integration for Splunk On-Call 🔗
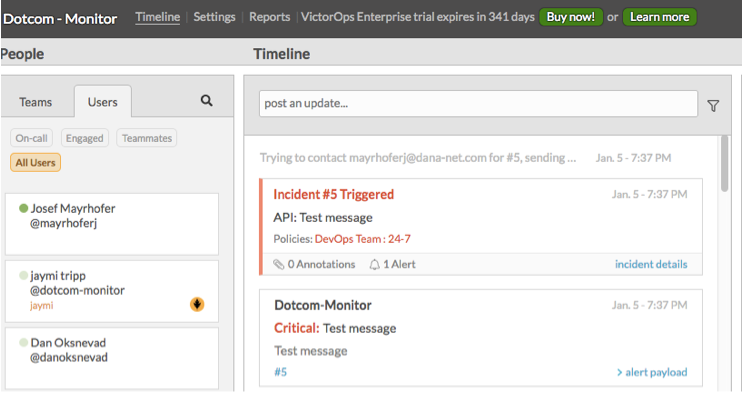
This guide provides instructions on how to activate the alerting integration between Dotcom monitor and Splunk On-Call. The Splunk On-Call integration with dotcom monitor creates an incident in the Splunk On-Call timeline whenever a Dotcom monitor alert is triggered.
Requirements 🔗
This integration is compatible with the following versions of Splunk On-Call:
Starter
Growth
Enterprise
Configuration 🔗
Log in to Dotcom monitor portal.
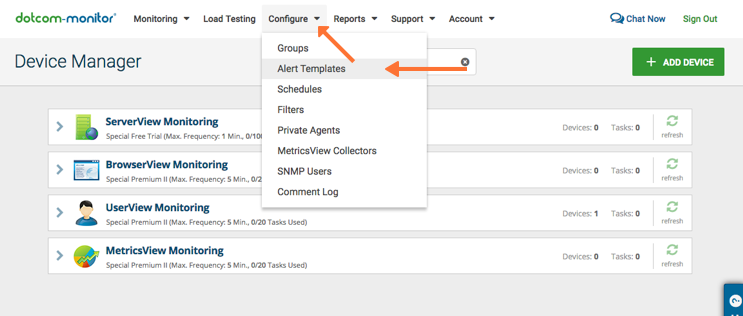
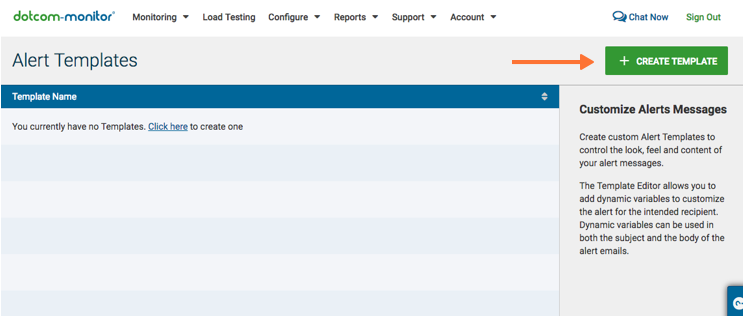
Select Configure, Alert Templates, Create Template.
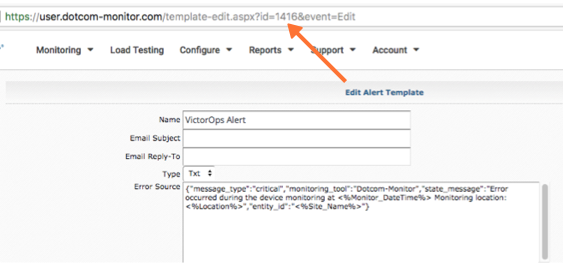
Delete the prepopulated content in the Alert Template and enter the following information for the Error Source, Test Source and Uptime Source fields:
Name
Name entered here
Email Subject
N/A
Email Reply-tp
Email entered here
Type
Txt
Error Source
{“message_type”:”c ritical”,”monitoring_tool”:”Dotco m-Monitor”,”state_message”:”Error occurred during the device monitoring at <%Monitor_DateTime%> Monitoring location:<%Locatio n%>”,”entity_id”:”<%Site_Name%>”}
Test Source
{“message_type”:” critical”,”monitoring_tool”:”Dotc om-Monitor”,”state_message”:”Test message”,”entity_id”:”Test message”}
Uptime Source
{“message_type”:”re covery”,”monitoring_tool”:”Dotcom -Monitor”,”state_message”:”Device <%Site_Name%> detected to be back online at <%Monitor_DateTime%> from monitoring location: <%Locatio n%>”,”entity_id”:”<%Site_Name%>”}
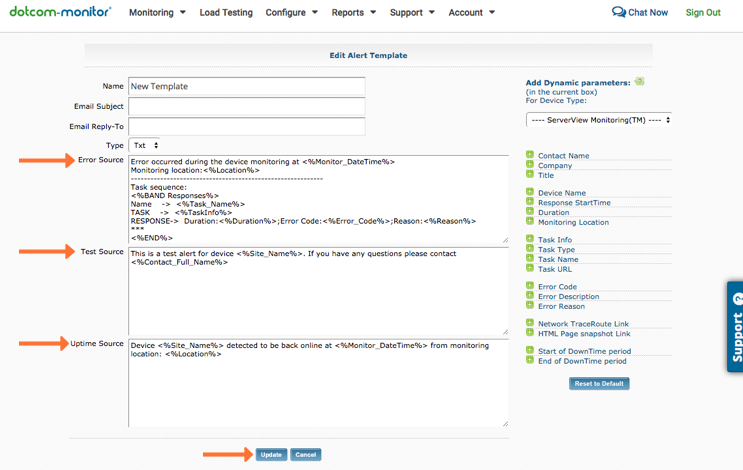
Select Update to save your Alert Template.
Select Configure / Alert Templates from the menu and then select the newly created Splunk On-Call Alert. Get your Template ID from the URL field and save it, as you need later.
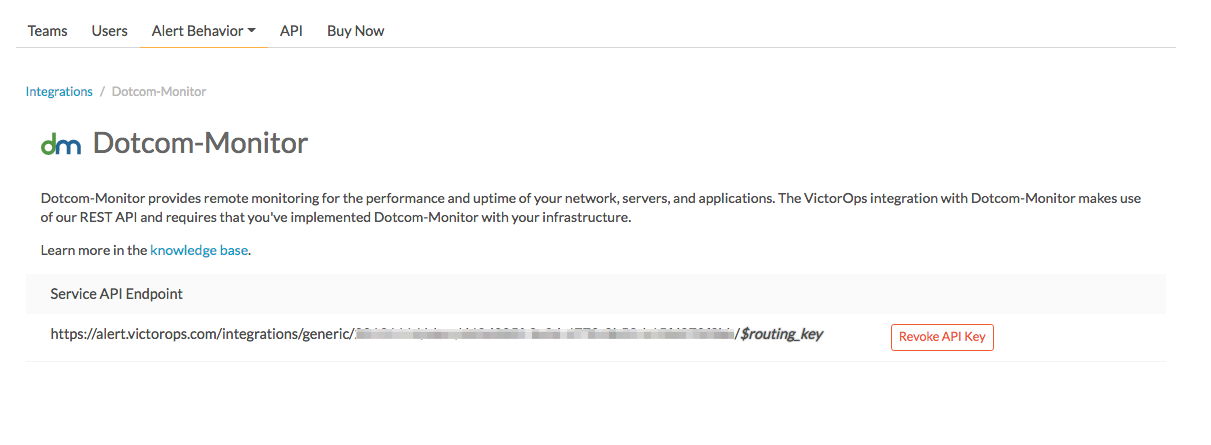
In Splunk On-Call, as an Admin user, select Integrations, Dotcom-Monitor.
If the integration isn’t active, select Enable Integration to generate your endpoint URL. Make sure to replace the
$routing_keysection with the routing key you intend to use.
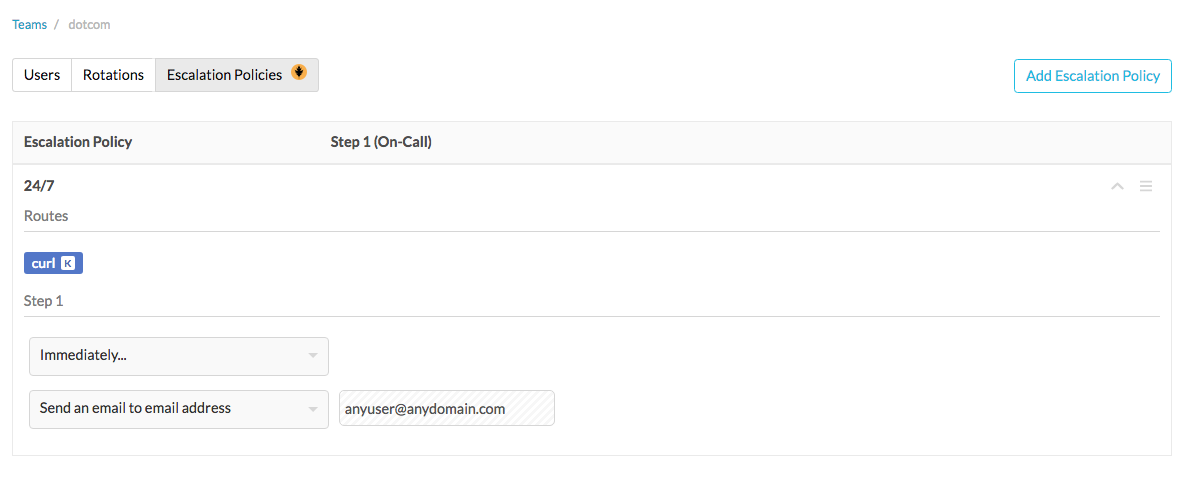
Create or edit a team and add the users who should receive alerts. Add an escalation policy. Note that routing keys appear after you’ve completed the routing key configuration.
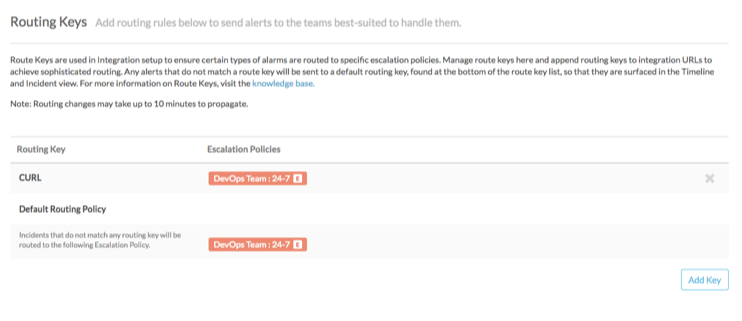
Add a routing key using the Add Key, named curl. Then add the escalation policy. Set the Default Routing Policy.
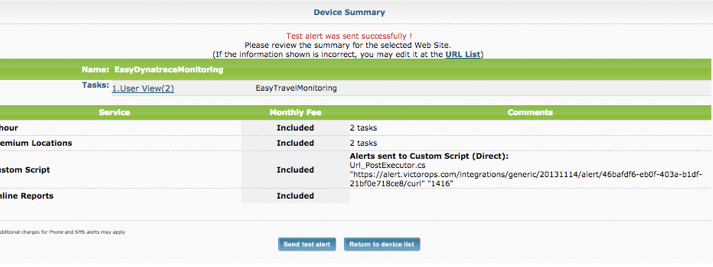
Go back into Dotcom monitor and edit your device. Navigate to the Alert Options section and select the custom script file. Add the following value into the Custom Script field:
Select Update to save this configuration.
