OpsDash integration for Splunk On-Call 🔗
OpsDash monitors your servers, services, databases, and application metrics. The following guide shows you the steps needed to integrate both systems.
In Splunk On-Call 🔗
From Splunk On-Call, go to Settings, Alert Behavior, Integrations.
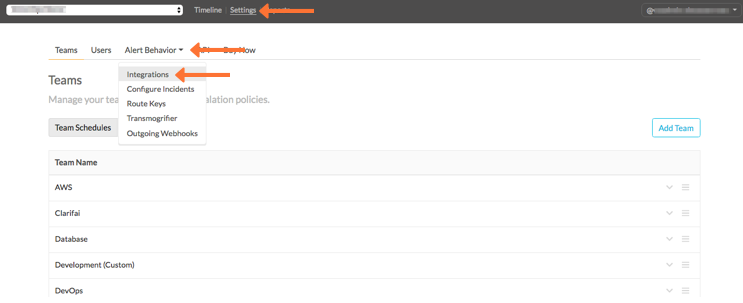
Select the OpsDash integration and copy the Service API Endpoint value to your clipboard.
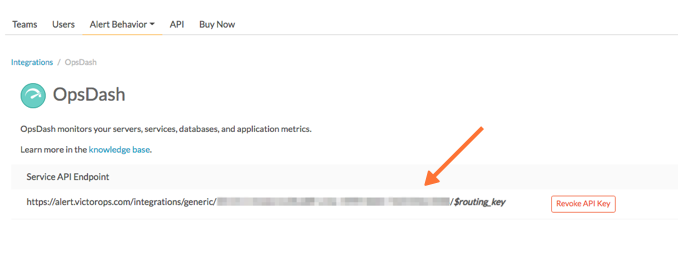
Make sure to add the appropriate routing key to the end of the URL. See Create Routing Keys in Splunk On-Call for more information.
In OpsDash 🔗
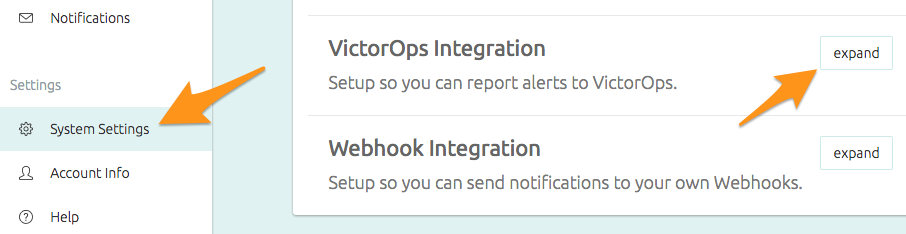
In Scalyr, select on the System Settings tab, then expand next to the VictorOps Integration.
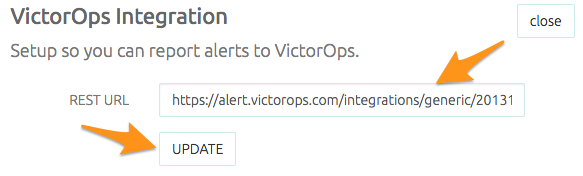
Paste the Service API Endpoint from the previous section into the REST URL field and select UPDATE.
Select the Notifications` tab, then select Add another under Notification Rules.
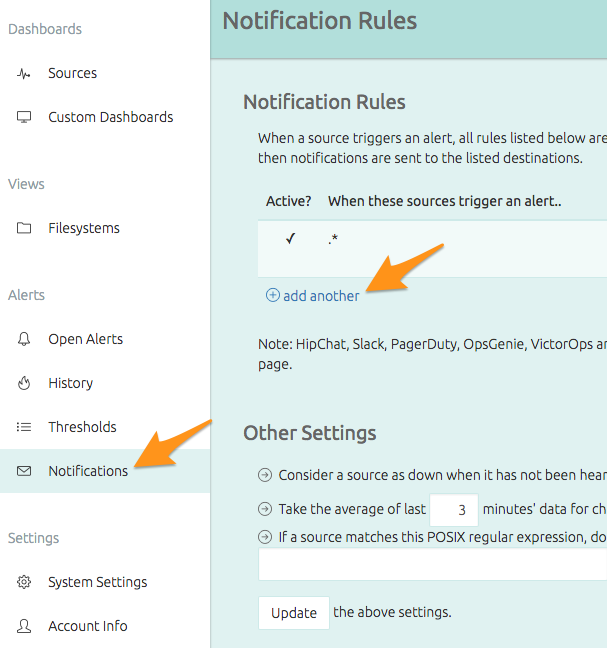
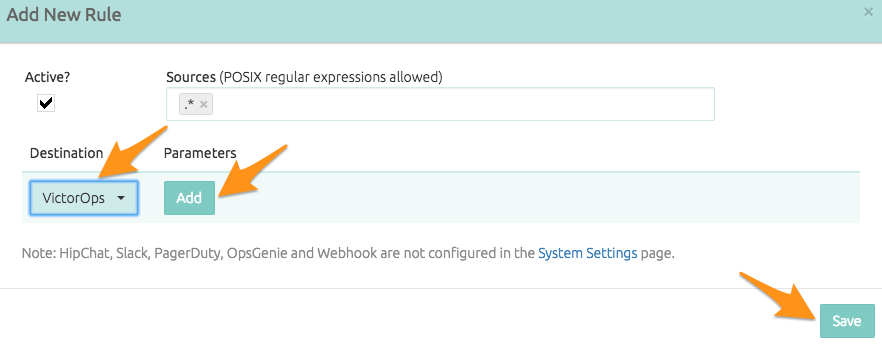
In the Add New Rule window, select VictorOps from the menu, select Add, then select Save.
Now you can set up a test alert in OpsDash to verify that the integration is working:
Select any source to open its dashboard, then select any graph.
Scroll down and select the metric you want to alert on.
Scroll down and add alert thresholds.
Add a value that can trigger an alert immediately. Make sure to save.
Within a minute or so, your alert is generated in OpsDash. If it isn’t, you might need to adjust your threshold settings.